
Figure 1.
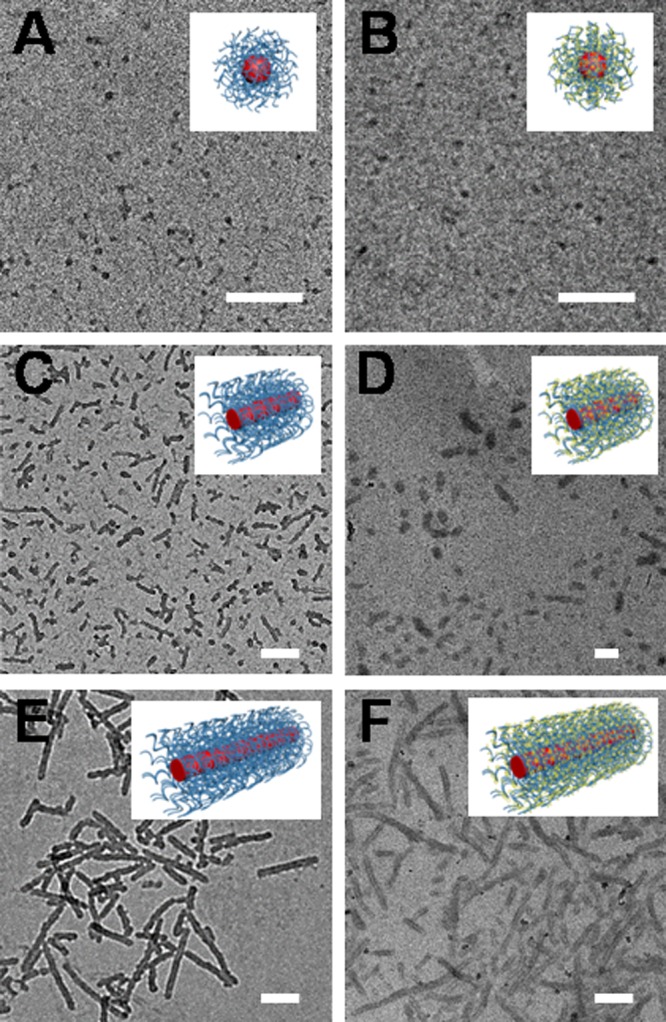
TEM images showing various nanoparticles before (A, C, E) and after (B, D, F) shell functionalization with mannose. (A, B) Spherical micelles 1 and M1; (C, D) Short cylindrical micelles 2 and M2; (E, F) Long cylindrical micelles 3 and M3. TEM samples were air-dried on carbon grids. Scale bar = 200 nm.