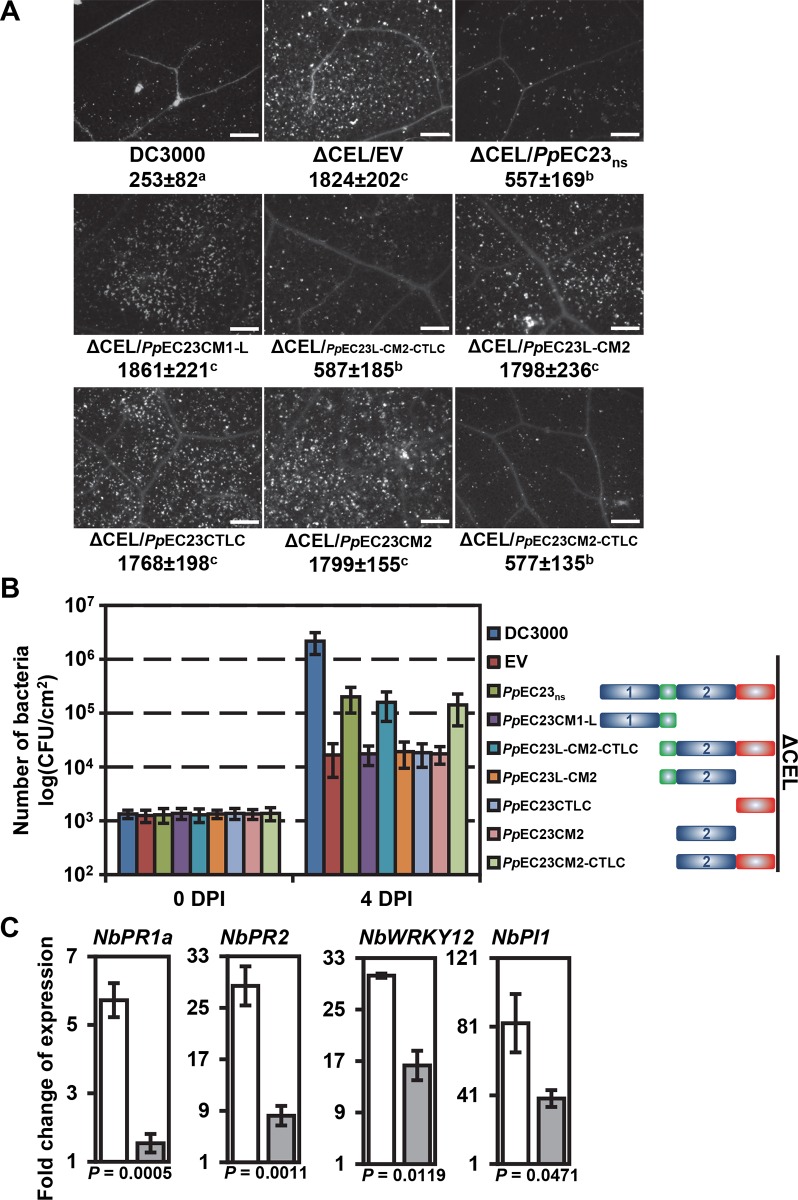
Fig 3. PpEC23 suppresses basal defense responses.
A. Callose deposition in leaves of A. thaliana Col-0 induced by Pst DC3000, CUCPB5115 (ΔCEL)/EV, ΔCEL/PpEC23ns or ΔCEL/truncated constructs stained with aniline blue. The average number of callose spots ± standard deviation is listed under each representative image. Pair-wise t-tests were performed and a, b, c were designated groups with statistically significant difference. Bar = 50 μm. Representative images are shown (n ≥ 24). B. Bacterial growth in planta of Pst DC3000, ΔCEL/EV, ΔCEL/PpEC23ns or ΔCEL/truncated constructs. Diagrams of PpEC23ns or truncated constructs of PpEC23 are provided to the right of the graph. Initial inoculum was adjusted uniformly to 105 CFU/mL. Numbers of bacteria were evaluated at 0 dpi and 4 dpi. C. Transcript level fold change of immune marker genes PR1a, PR2, WRKY12 and PI1 in leaves of N. benthamiana stably transformed with EV (white bars) or FLAG-PpEC23ns (gray bars) at 6 hpi with P. fluorescens strain EtHAn. NbAct1 was used as the internal reference gene. T-tests were performed for each comparison. The corresponding P value is shown in the figure. Four biological and four technical replicates were performed.

