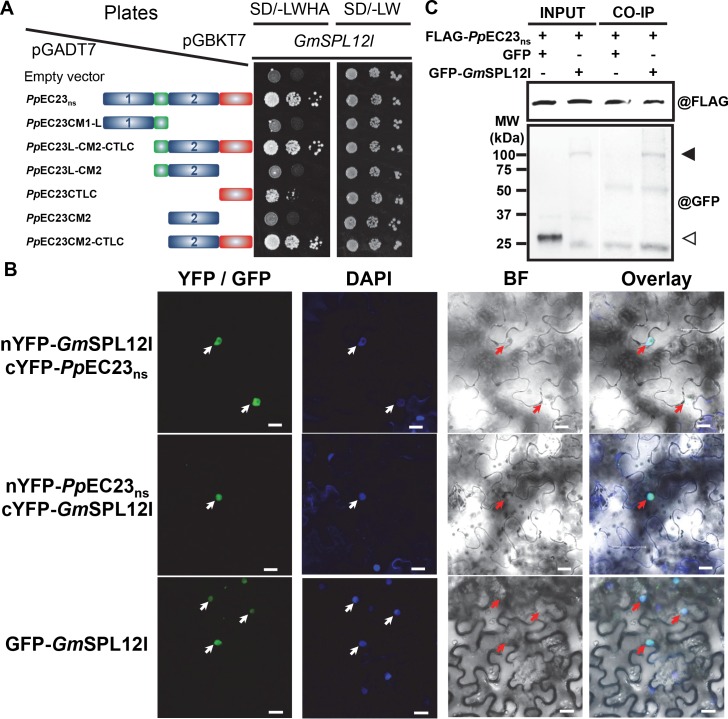
Fig 5. PpEC23 interacts with soybean transcription factor GmSPL12l.
A. PpEC23 and GmSPL12l interaction confirmed by Y2H. The empty vector, pGADT7, was included as a negative control. SD/-LWHA and SD/-LW represents SD (-Leu/-Trp/-His/-Ade) and SD (-Leu/-Trp), respectively. The structural diagrams of PpEC23ns or truncated constructs of PpEC23 are shown next to the corresponding strain. B. PpEC23 and GmSPL12l interaction detected in N. benthamiana nuclei by BiFC assay. YFP/GFP, yellow or green fluorescent protein epifluorescence. BF, bright field. DAPI signal was used as a nuclear marker. Arrows indicate nuclei. Representative images are shown (n ≥ 20). Bar = 20 μm. C. PpEC23 and GmSPL12l interaction confirmed by co-immunoprecipitation assay (CoIP). MW, molecular weight marker. The solid triangle indicates the band corresponding to the GFP-GmSPL12l fusion protein. The white triangle indicates the GFP protein band. @FLAG and @GFP indicate detection using anti-FLAG and anti-GFP antibodies, respectively.

