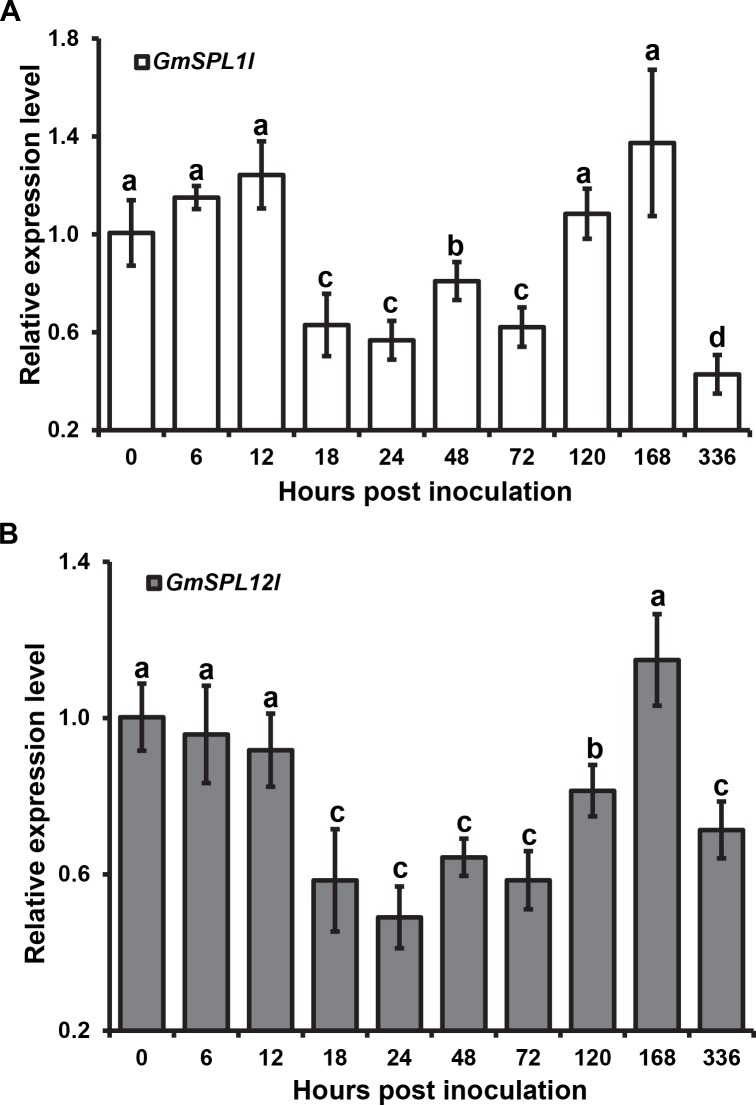
Fig 6. The expression profile of GmSPL1l (A) and GmSPL12l (B) mRNA during P. pachyrhizi infection.
Expression levels are relative to the expression in soybean without P. pachyrhizi infection. Three independent biological and four technical replicates were performed. Error bars = standard deviation. Single factor ANOVA and pair-wise two-tailed t-test analyses were performed. The letters above the error bars indicate the different groups with statistical significance (P < 0.05). The soybean Ukn2 gene [41] was used as the internal reference gene.

