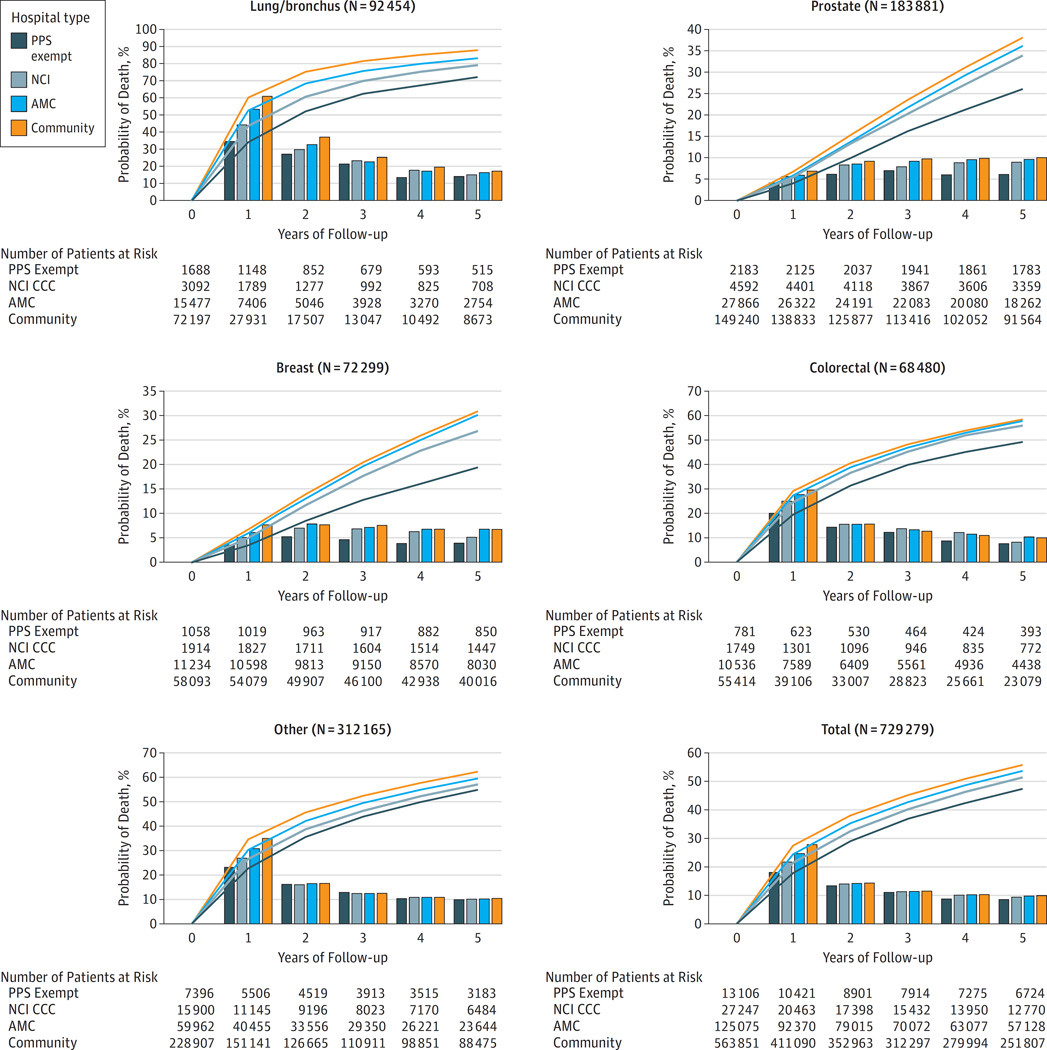
Figure 1.
Risk of death each year (bars) and over time (curve) under the care of different categories of hospitals that treat patients with cancer after Medicare risk adjustment.* Note y-axes are scaled to improve visibility. (PPS = prospective payment system exempt; NCI = hospitals designated by the National Cancer Institute that are not PPS; AMC = Academic hospitals that are not PPS or NCI; Comm = other types of hospitals, *Adjusted for age, sex, median income in the ZIP code of residence and for comorbidity using the 3M CRG software as explained in Methods.)

