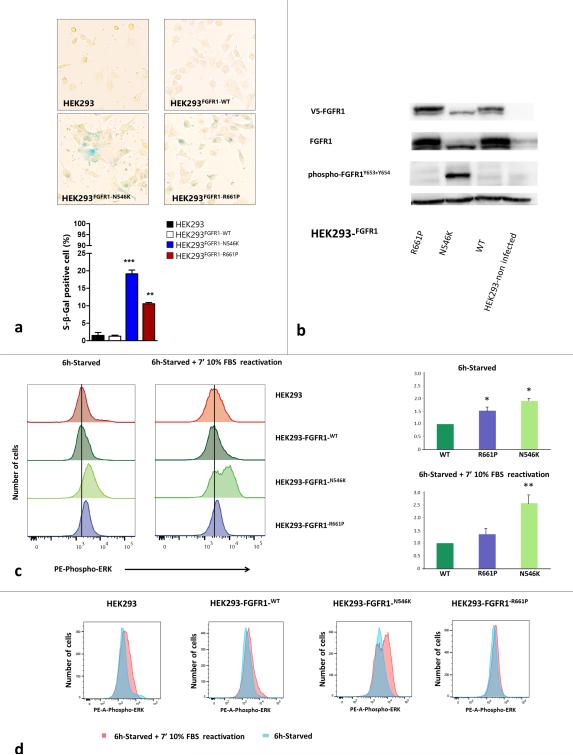
Fig. 4. Functional studies of the p.R661P and p.N546K mutations in FGFR1 Tyrosine Kinase Domain.
a) Senescence marker β-galactosidase staining in p.R661P and p.N546K mutants compared to FGFR1-WT (wild-type) over-expressing cells and non-infected parental cell line HEK293. Graph shows the percentage of β-galactosidase positive cells in HEK293, HEK293-FGFR1-WT, HEK293-FGFR1-N546K and HEK293-FGFR1-R661P. We found a significantly higher number of senescent associated β-galactosidase positive cells (blue cells) in both mutants than in the parental and FGFR-WT overexpressing cell lines (* p < 0.05; ** p < 0.001; *** p < 0.001). Senescence rate was also higher in p.N546K than p.R661P mutants, probably due to a lower level of ERK-signaling in the p.R661P mutant (p < 0.001, one-way ANOVA followed by Tukey's multiple comparison test). b) Immunoblot showing total FGFR1 and phosphorylated FGFR1 across HEK293 parental cell line, FGFR-WT, p.N546K and p.R661P under normal growing conditions (24h growing in 10% FBS media). p.N546K mutant shows a constitutively phosphorylated FGFR1, thus confirming in silico predictions. In contrast, p.R661P mutant shows basal levels of phospho-FGFR1 similar to those observed in FGFR1-WT overexpressing cells. V5-FGFR1 = FGFR1 tagged to V5. c) ERK signalling measurement by assessing phospho-ERK levels in serum deprivation and subsequent reactivation with growth media (10% FBS) for 7 minutes. Left - histograms show phospho-ERK-PE labelled fluorescence in mutants p.R661P, p.N546K and in FGFR1-WT and HEK293 parental cell line. Black vertical line marks median phospho-ERK levels in FGFR1-WT cell line during starvation, highlighting the increased levels in both mutants compare to FGFR1-WT cells. Right - relative fluorescence for p.N546K and p.R661P was calculated from the ratio of fluorescence for each mutant and that of WT from the same experiment, normalizing FGFR1-WT fluorescence to 1.0 under both starvation and stimulation conditions. The results of two technical replicates from three experiments are shown. Error bars shows standard errors in starvation conditions and standard deviations in reactivation conditions. Considering starvation condition as basal level, p.R661P basal levels were higher than FGFR1-WT ( * = p < 0.05 Kruskall Wallis test followed by a Student-Newman-Keuls), differences that were not seen when the stimulation was applied (10% FBS for 7 mins). Under serum deprivation, p.N546K phospho-ERK expression was higher than in both p.R661P and FGFR-WT cells ( both p < 0.05). These differences were accentuated when the cells were reactivated (both p < 0.001). The Kruskall Wallis test followed by a Student-Newman-Keuls method was used in starvation and one-way ANOVA followed by a Student-Newman-Keuls method under reactivation conditions. d) Overlaying of both histograms for phospho-ERK under serum deprivation versus reactivation conditions in each of the cell lines showing the shift in the fluorescence intensity. Only p.N546K shift was significantly increased compare to WT and p.R661P (p < 0.001, one-way ANOVA followed by Tukey's multiple comparison test)

