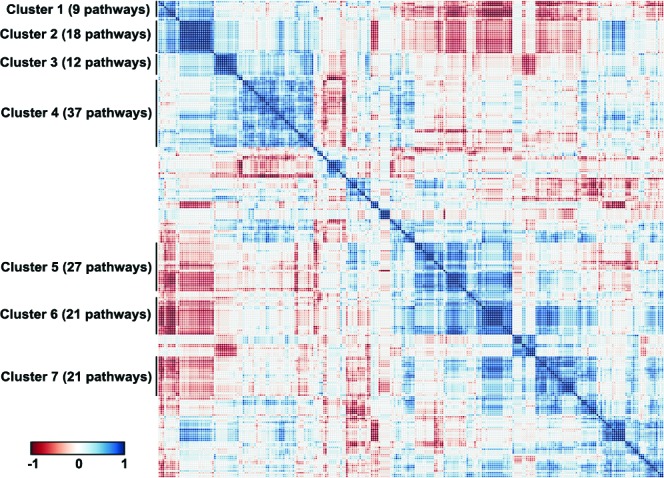
Figure 3. Signalling pathways correlation plot.

Correlation plot of the activities of 269 intracellular signalling pathways among the fourteen investigated normal and asthmatic BSM tissue samples. Seven clusters of commonly regulated pathways are indicated on the figure. Color key represents correlation coefficients between the pathways ranging from -1 to 1.
