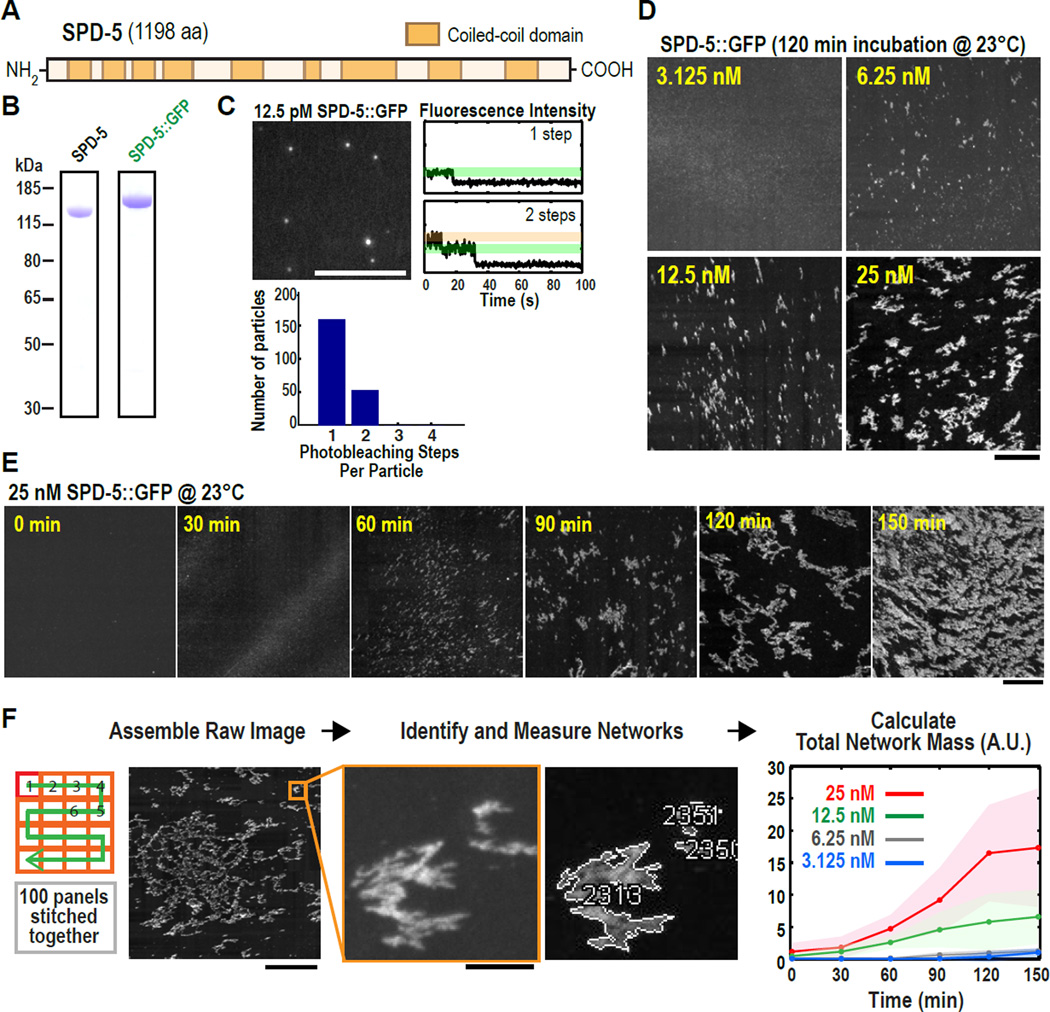
Fig. 1. Recombinant SPD-5 molecules polymerize into expansive networks over time in a concentration-dependent manner in vitro.
(A) SPD-5 sequence with coiled-coil domains predicted by the MARCOIL algorithm (31) at 90% threshold.
(B) Coomassie-stained gels depicting purified full-length SPD-5 and SPD-5::GFP.
(C) 12.5 pM SPD-5::GFP was squashed under a cover slip and imaged continuously by total internal reflection microscopy. The intensity of each fluorescent spot was measured over time and photobleaching steps per spot were counted (n = 210). Representative photobleaching profiles are shown. Scale bar, 5 µm.
(D) Visualization of different concentrations of SPD-5::GFP after 120 min. Scale bar, 25 µm.
(E) 25 nM SPD-5::GFP was incubated at 23°C, then squashed under a coverslip at 30 min intervals. Scale bar, 25 µm.
(F) Flowchart of automated SPD-5::GFP network quantification. For each sample, 100 images were collected, stitched together, a threshold was applied, and the networks were identified and measured. The graph plots the integrated intensity of all networks (Total Network Mass) per sample at each time point (n= 4–10; mean with 95% confidence intervals). Scale bars, 25 µm (first panel), 2.5 µm (inset).

