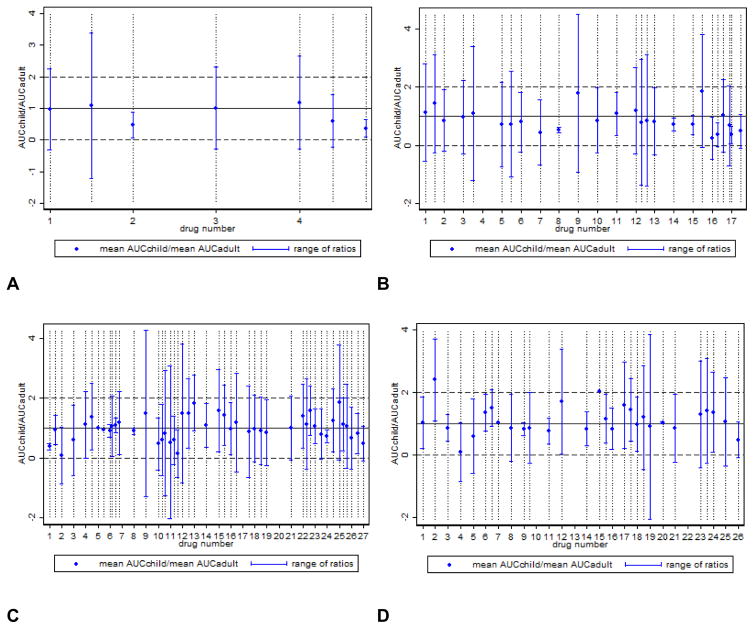
Figure 2.
Comparison of pediatric to adult area under the concentration-time curve (AUC) without outliers: age (A) <30 days, (B) 1 month–<2 years, (C) 2–11 years, and (D) 12–16 years. Drug products were considered outliers and excluded from the figure if the range of ratios for the drug product was > 2.5 SD of the range of ratios for the age group of interest. Multiple studies for a single drug will have the same identifying number (e.g., 3 studies supporting the 2–11 age group for a drug will be located on the x-axis at 7.0, 7.4, 7.8). Blue dots represent the AUCchild/AUCadult median (or mean) ratio. The solid black line represents the equivalence median (or mean) AUC between children and adults (ratio=1). Horizontal dashed lines represent the upper and lower bounds of a normalized adult AUC range. Ratios and ranges that fall within the dashed lines indicate pediatric AUC values within the adult range.

