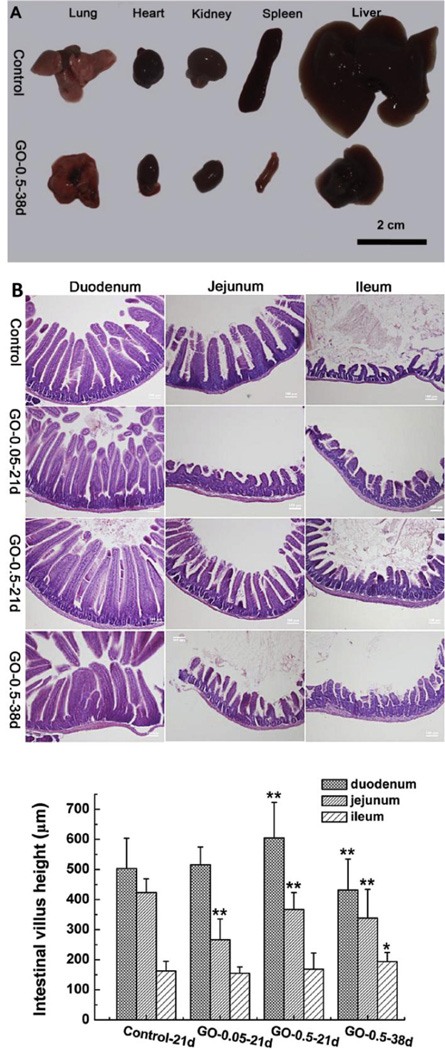
Figure 13.
(A) Pathological examination of lungs, heart, kidney, spleen and liver collected from control and GO administered mice (0.5 mg/ml) after 38 days showing severe atrophy of all major organs. (B) H&E staining of duodenum, jejunum and ileum of GO treated filial mice at 0.05 mg/ml for 21 days and 0.5 mg/ml for 21 and 38 days. The length, width and height of villi of GO administered groups were longer than control groups. Scale bars represent 100 µm. Adapted from Reference [110] with permission, copyright © Elsevier, 2015.

