Figure 19.
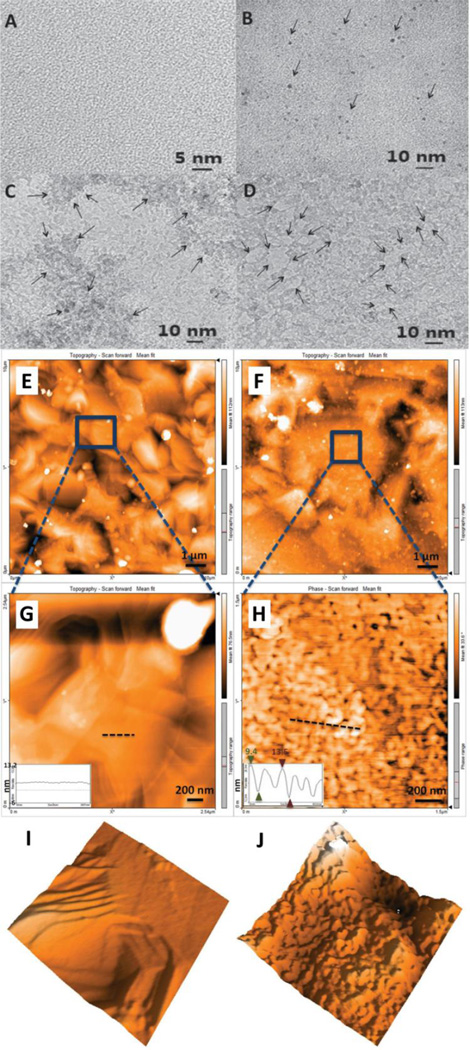
(A–D) Representative transmission electron microscopy images of multilayered graphene treated with (A) DI water, (B) 1 µM H2O2, (C) 100 µM H2O2 and (D) 10000 µM H2O2 for 10 hours. Arrows in (B) indicate the formation of holes on graphene sheets and in (C) indicate the formation of lighter (few graphene layers) and darker regions (multiple graphene layers) suggesting the degradation of multilayered graphene. (E–J) Representative atomic force microscopy images of multilayered graphene on Ni wafer. (E and G) are topographical scans of graphene incubated with DI water for 25 hours. (G and H) show graphene after 25 hours of incubation with 10000 µM H2O2. Inset in images (G and H) are corresponding height profiles. (I and J) are 3D representations of images G and H. Adapted from Reference [133] with permission, copyright © John Wiley and Sons Inc., 2014.

