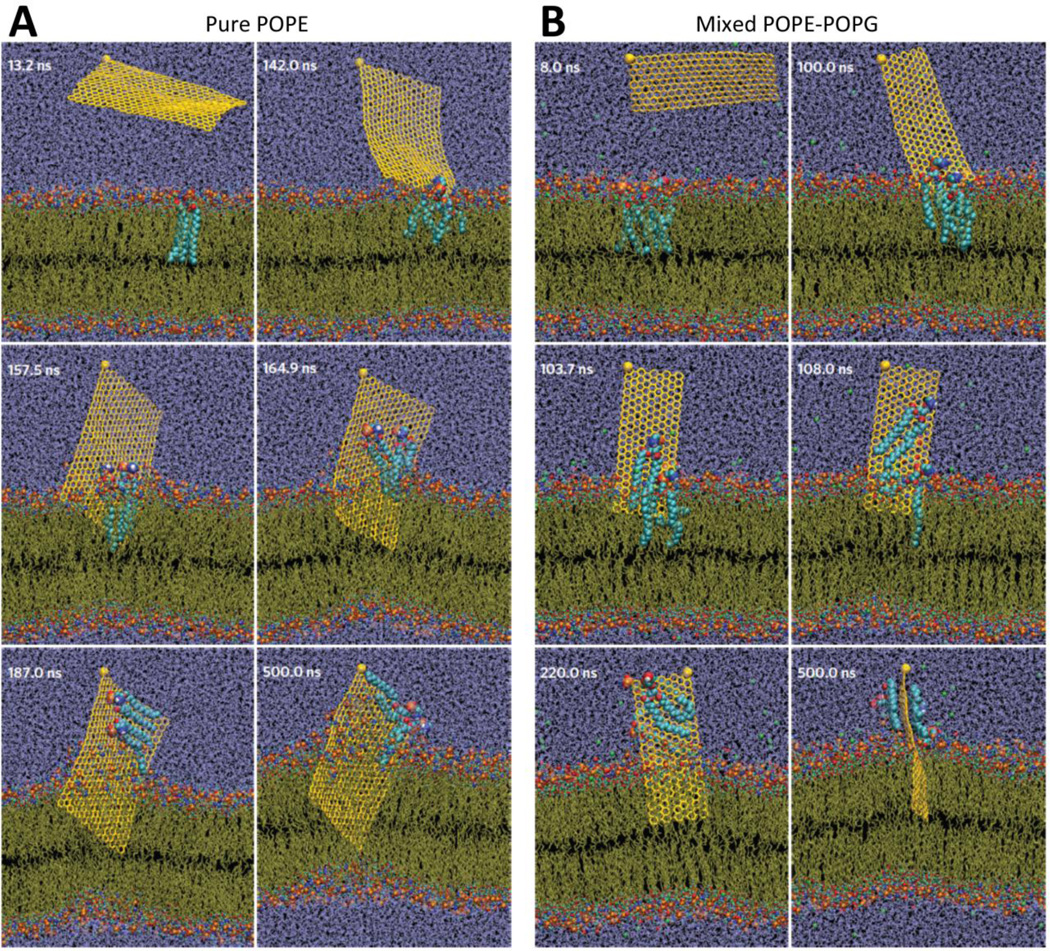
Figure 25.
Representative simulated trajectories of graphene nanosheets insertion and lipid extraction in the outer membrane (pure palmitoyloleoylphosphatidylethanolamine, POPE) and inner membrane (mixed POPE-POPG) of E. coli. Water is represented in violet and phospholipids in tan lines with hydrophilic charged atoms as colored spheres (hydrogen – white, oxygen – red, nitrogen – dark blue, carbon – cyan and phosphorus – orange). Graphene is shown as yellow sheet with a large sphere marked at one corner representing restrained atom in simulations. Extracted phospholipids are shown as large spheres. Adapted from Reference [145] with permission, copyright © Macmillan Publishers Limited, 2013.

