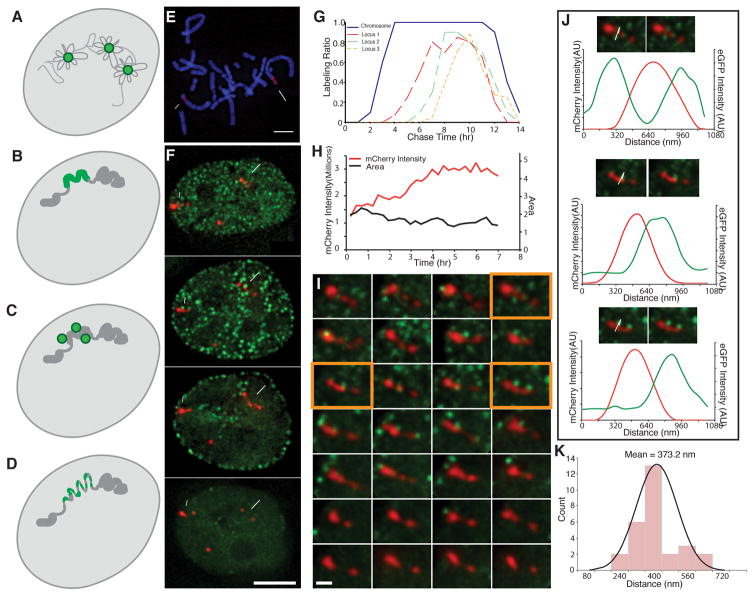
Fig. 1. Live-cell microscopy reveals minimal global changes in large-scale chromatin structure of tagged PDC chromosome loci during DNA replication.
(A–D) Four models for DNA replication spatial organization- DNA (grey), replication foci (green): (A) Replication factory model- dispersed DNA is reeled in and out of replication foci during replication. (B) Replication-in-place model- replication foci correspond to pre-existing Mbp-scale units of large-scale chromatin compaction undergoing replication. (C) Modified replication factory model- replication factories lie immediately adjacent to pre-existing Mbp-scale units of large-scale chromatin compaction. (D) Modified replication-in-place model- replication foci correspond to units of large-scale chromatin compaction that transiently decondense during in-place DNA replication. (E) Mitotic spread (DAPI, blue) of PDC βA2 cell clone shows three gene-amplified chromosome regions (mCherry-LacI, red) named in order of decreasing size (locus 1, long arrow; locus2, short arrow; locus 3, arrow head). (F) Tagged (red, mCherry-LacI) chromosome regions (loci 1–3, long arrow, short arrow, arrowhead, respectively) and GFP-PCNA foci (green) visualized as 2D projections as a function of time (hrs) after release from late G1/early S phase block. PCNA foci adjacent or near amplified chromosome loci are only seen in early to middle S-phase. (G) Fraction (LabeledRatio, y-axis) of labeled mitotic spreads (blue) or chromosome loci (locus 1-orange, locus 2-green, locus 3-dotted orange) as a function of chase time after EdU pulse labeling reveals early (loci 1–3) to mid-S phase (loci 1) labeling. (H) Locus 2 DNA replication occurs without global decondensation of large-scale chromatin fiber as shown by doubling of mCherry-LacI signal from 15 mins to 4–5 hrs (H, red) without significant change in projected area (H, black). (I) Visualization of locus 2 (red, mCherry-LacI), as seen in projections at 15 min intervals (left to right, top to bottom) after release from late G1/early-S phase block. GFP-PCNA foci (green) adjacent to locus 2 are observed in optical sections from 15 min (begin) to 4 hrs 45 mins (end). (J) Images and intensity line-scans (along white arrows) from orange-framed panels (I) showing GFP-PCNA (green, image and line-scans) associated with mCherry-LacI (red, image and line-scans) signals. (K) Histogram of measured peak-to-peak distances between GFP-PCNA and mCherry-LacI signals for 28 foci from (I). Scale bars: 5 μm (E,F), 1 μm (I). See also Fig. S1 and Fig. S2.

