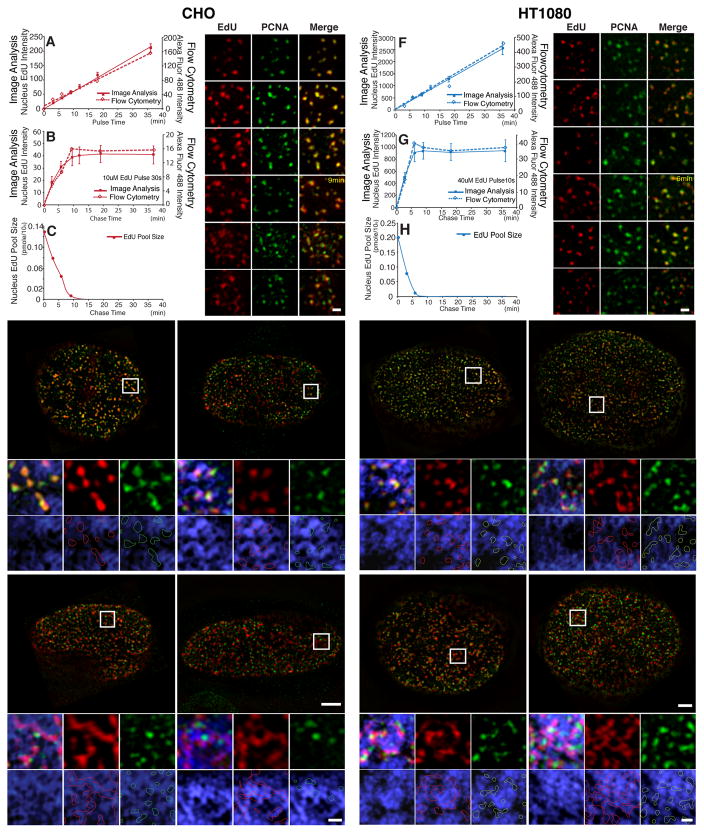
Fig. 2. Visualizing nascent DNA emerging from replication foci and incorporating into large-scale chromatin structure with improved pulse-chase conditions.
(A,F) EdU incorporation increases linearly with duration of pulse labeling time (mins, x-axis) for both CHO (A) and HT1080 cells (F) as measured by image analysis (solid squares and line, y axis-left) or flow cytometry (hollow squares, dashed line, y axis-right). (B,G) EdU incorporation plateaus in CHO cells (B) at ~9 min after 30 sec EdU pulse and in HT1080 cells (G) at ~6 min after 10 sec EdU pulse. (C,H) EdU cellular pool concentration by LC-MS/MS after 30 sec pulse in CHO cells (C) or 10 sec pulse in HT1080 cells (H). EdU concentrations were undetectable at longer chase times (18 and 36 mins for CHO cells; 9, 18, and 36 mins for HT1080 cells). (D,I) Exit of EdU (red) from GFP-PCNA foci becomes obvious at chase-times of ~9 min in CHO cells (D) and ~6 min in HT1080 cells (I). Scale bars = 0.5 μm. (E,J) EdU signals (red) versus GFP-PCNA foci (green) and DAPI (blue) after chase-times of 9 min, 18 min, 36 min, and 1 hr in CHO cells (E) or 6 min, 12 min, 18 min, and 36min chase in HT1080 cells (J). DNA (blue) colocalizes with GFP-PCNA (green) foci at 9 min (CHO) or 6 min (HT1080), is still compact in shape but has largely separated from GFP-PCNA foci by 18 min (CHO) or 12 min (HT1080), and has spread out within DAPI-dense regions at 36 min (CHO) or 18 min (HT1080) with spreading continuing through to 1 hr (CHO) or 36 min (HT1080). Longer chase times give increased colocalization of EdU signal (red outlines) with DAPI-rich regions, while PCNA foci (green outlines) remain over DAPI-poor regions. EdU area increases in CHO cells (E) from 9 min to 1 hr chase-time and from 6 min to 36 min chase-time in HT1080 cells (J). Panels (below) show enlargements of regions in square white boxes (top). Scale bars = 5 μm (top panels), 1 μm (bottom panels). See also Fig. S3.

