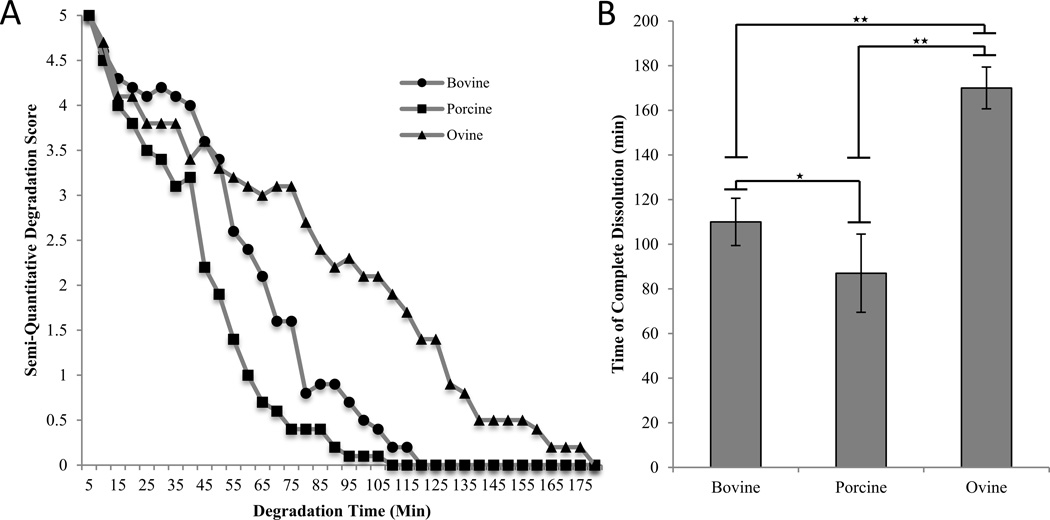
Figure 6.
Enzymatic stability of collagen samples from bovine, porcine, and ovine scaffolds. A. Semi-quantitative degradation score of bovine, porcine, and ovine collagen scaffold samples as a function of degradation time. Circles, squares, and triangles represent bovine, porcine, and ovine samples, respectively. B. Time of complete dissolution for scaffold samples. ★ indicates p<0.05 and ★★ p<0.01.

