Abstract
Purpose
To evaluate changes in T-cell populations in peripheral blood following bland hepatic artery embolization HAE).
Materials and Methods
Twelve patients received bland HAE to treat primary (n=5) or metastatic (n=7) liver tumors, using microsphere and polyvinyl alcohol (n=8) or microsphere alone (n=4). Patient peripheral blood samples were collected within 1 month before HAE, within 1 week after HAE (early post-HAE period), and 2–8 weeks after HAE (follow-up period). Peripheral blood populations of cytotoxic T-cells (CTL), CD4+ T-cells: type-1 (Th1) and type-2 helper T-cells (Th2), and regulatory T-cells (Treg) were evaluated using flow cytometry. Changes in T-cell populations before and after bland HAE were compared using paired t-tests.
Results
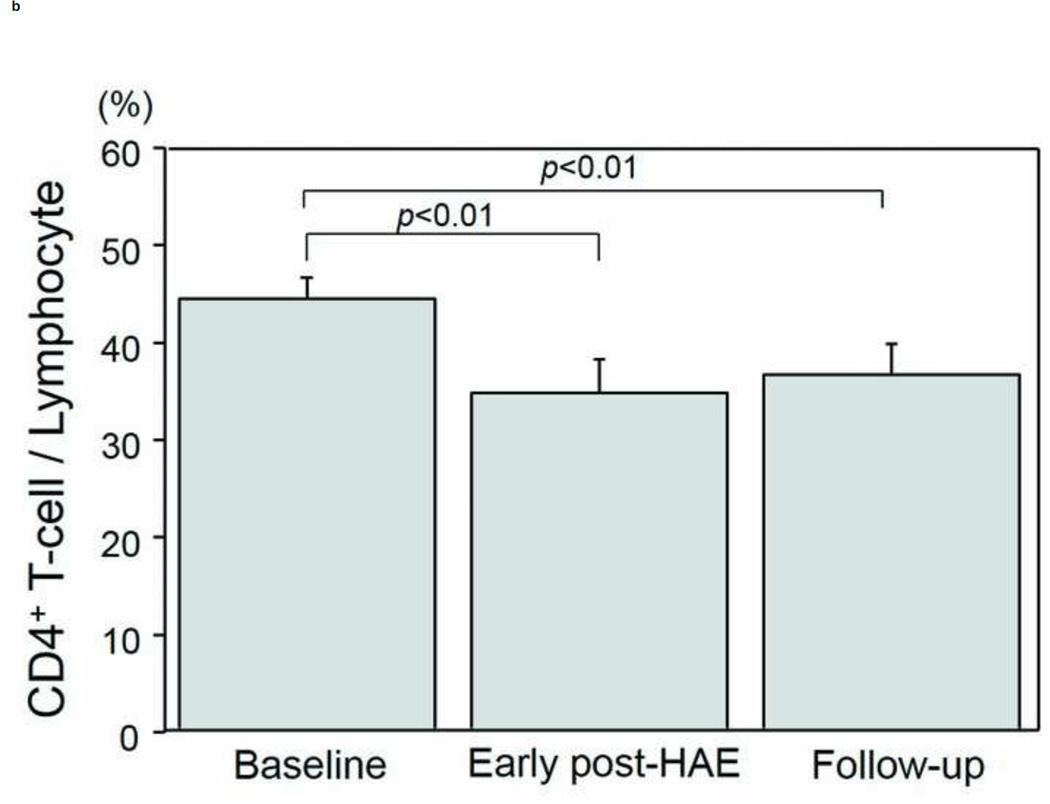
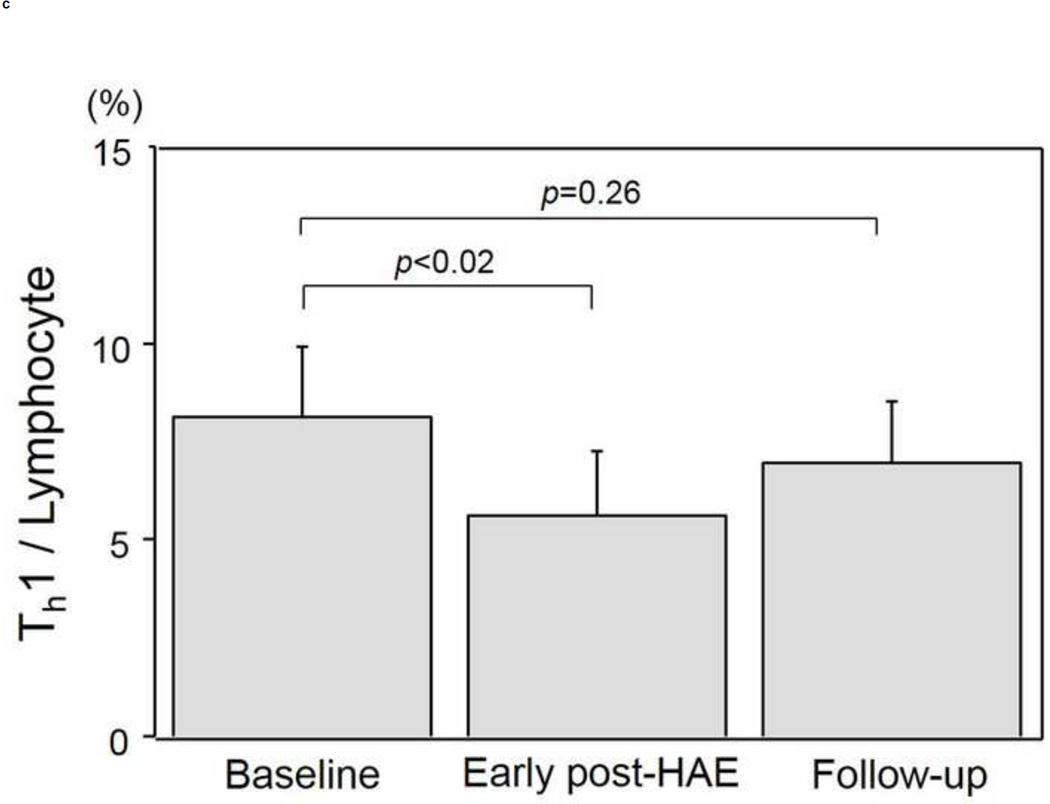
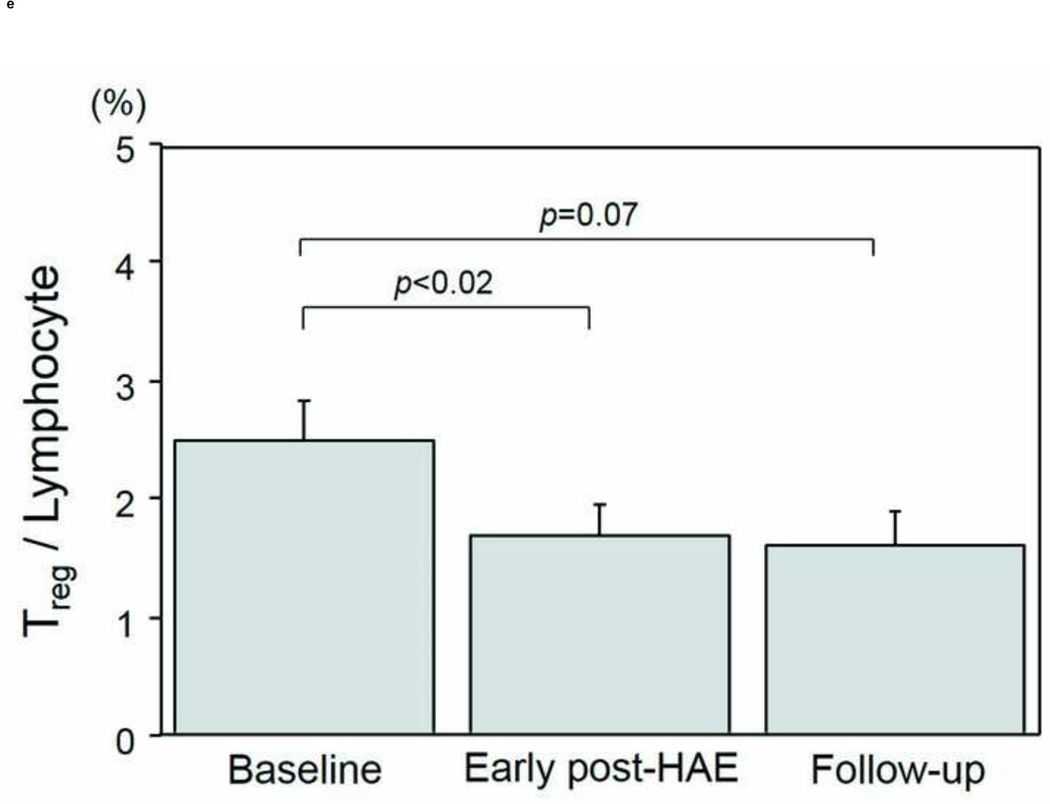
Peripheral blood CD4+ T-cell populations decreased significantly both in the early post-HAE (44.0±2.2 to 34.4±3.6%, p< .01) and on follow-up (44.0±2.2 to 36.3±3.0%, p< .01). Among the individual CD4+ T-cell subtypes, Treg (2.5±0.3 to 1.7±0.2%, p< .02) and Th1 (8.1±1.8 to 5.6±1.6%, p< .02) populations decreased significantly in the early post-HAE period only. The presence of extrahepatic disease was associated with decreasing Treg population (p< .04).
Conclusion
Following HAE, the peripheral blood T-cell environment is changed with decrease in both Treg and Th1 populations.
INTRODUCTION
Traditionally, hepatic artery embolization (HAE) efficacy has been attributed mainly to its direct ischemic tumoricidal effect (1,2). Little attention has been devoted to the potential for immune environment. Actually, HAE induces tumor necrosis in situ by blocking the tumor blood supply. Therefore, it can create a source of tumor-associated antigen (3,4). Indeed, previous reports of the literature have shown that tumor-specific T-cell response increases after transcatheter arterial chemoembolization (3,4). Moreover, HAE induces local inflammation within the liver leading to the release of various cytokines and chemokines (5–8). Induction of tumor-associated antigens as well as the release of cytokines and chemokines might change the systemic T-cell environment. Therefore, we hypothesize that HAE can alter the peripheral blood T-cell environment. Elucidating the changes in T-cell environment is important because cumulative evidence suggests that T-cell mediated immune response affects the disease progression and patient prognosis for cancer of several types (9–15). However, the effects of HAE on the T-cell environment have not been elucidated satisfactorily in earlier reports of the literature.
For this study, we evaluated changes in peripheral blood T-cell subtypes following bland HAE.
MATERIALS AND METHODS
Patients
This single-center prospective study was approved by our institutional review board. Written informed consent to participation was obtained from all participants who underwent HAE for the treatment of primary or secondary malignancy. Exclusion criteria included prior ablation or embolization procedures within 30 days and patients who did not require a blood draw before the procedure at the time they were evaluated for eligibility.
Between January 2014 and November 2014, five interventional radiologists (AC, GG, KB, SB, and JE) and one research assistant (CT) recruited study participant, and 20 patients were enrolled. In 7 of these 20 patients, scheduled laboratory testing was not performed after the procedure. In addition, the blood sample was insufficient for analysis in 1 patient, leaving 12 patients who formed the basis of this study.
Subjects were 9 men (75.0%) and 3 women (25.0%) with mean age of 56.2±3.6 (range 39–75) years. The most common primary diagnosis was neuroendocrine tumor (50.0%, 6/12), followed by hepatocellular carcinoma (HCC) (41.7%, 5/12) and leiomyosarcoma (8.3%, 1/12). Extrahepatic metastases were present in 6 patients (50.0%, 6/12). Patient and tumor characteristics are presented in Table 1. No patient received other cancer therapy for 30 days or more before study enrollment until the end of follow-up.
Table 1.
Patient backgrounds, tumor characteristics, hepatic artery embolization
| Parameter | |
|---|---|
| Patient No. | 12 |
| Age (years) | 56.2±3.6 |
| ≤60 | 7 (58.3) |
| >60 | 5 (41.7) |
| Gender | |
| Male | 9 (75.0) |
| Female | 3 (25.0) |
| Primary diagnosis | |
| Neuroendocrine tumor | 6 (50.0) |
| Hepatocellular carcinoma | 5 (41.7) |
| Leiomyosarcoma | 1 (8.3) |
| Child-Pugh score | |
| 5 | 10 (83.3) |
| 6 or more | 2 (16.7) |
| Tumor number | |
| Single | 2 (16.7) |
| Multiple | 10 (83.3) |
| Maximum tumor diameter (cm) | |
| ≤5 | 9 (75.0) |
| >5 | 3 (25.0) |
| Extrahepatic lesion | |
| No | 6 (50.0) |
| Yes | 6 (50.0) |
| Range of HAE | |
| Lobar | 8 (66.7) |
| Segmental | 4 (33.3) |
| Maximum AST after HAE (IU/l) | |
| ≤100 | 6 (50.0) |
| >100 | 6 (50.0) |
| Initial therapeutic response on mRECIST | |
| CR or PR | 9 (75.0) |
| SD or PD | 3 (25.0) |
Continuous data are presented as mean and standard error (SE). Numbers in parentheses are percentages. HAE, hepatic artery embolization; AST, asparatate aminotransferase; mRECIST, modified response evaluation criteria in solid tumours; CR, complete response; PR, partial response; SD, stable disease; PD, progressive disease
Hepatic artery embolization
Bland HAE was performed by five interventional radiologists (AC, GG, KB, SB, and JE). After routine hepatic angiography with a 4-french or 5-french angiographic catheters to identify hepatic arterial anatomy, tumor location, and feeding arteries, bland HAE was performed via the common femoral artery. Feeding arteries that supplied the target lesion(s) were catheterized as selectively as possible using microcatheters. Bland HAE was conducted using 40–100 µm microspheres (Embosphere®; Biosphere Medical Inc., Rockland, MA) in five patients, 100–300 µm microspheres in four patients, and both 40–100 µm and 100–300 µm microspheres in three patients. The endpoint of embolization was complete stasis of antegrade blood flow in the feeding arteries. To achieve complete stasis, additional embolization by polyvinyl alcohol (PVA) (PVA embolization particles; Cook, Inc., Bloomington, IN) was done in 4 of 5 patients who received HAE by 40–100 µm microspheres, 1 of 4 patients by 100–300 µm, and all three patients who received HAE by both 40–100 µm and 100–300 µm microspheres. If multiple lesions were present in the liver and selection of multiple feeding arteries was difficult, then lobar HAE was performed. Four patients received segmental HAEs by 40–100 µm microspheres plus PVA (n=3) or 40–100 µm microspheres alone (n=1). The remaining 8 patients received lobar HAE.
Blood collection
Patient peripheral blood was collected within 1 month before HAE, during the early post-HAE period (i.e. within 1 week after HAE), and during the follow-up period (i.e., 2–8 weeks after HAE). This timing of blood collection was chosen according to the previous study, which evaluated the serial changes in serum cytokines after HAE (6). In all, 20 mL peripheral blood was collected at each time point. Assessments of white blood cells (WBC) were performed using fresh blood samples at our clinical chemistry laboratories. Peripheral blood mononuclear cells (PBMCs) were isolated from heparinized blood using density gradient centrifugation medium (Ficoll-Paque; GE Healthcare Bio-Sciences, NJ, USA). Then, PBMCs were frozen immediately with freezing medium (Cell Freezing Medium-DMSO 1×; Sigma-Aldrich Corp., MO, USA) at −80 °C and were stored until analysis.
Surface and intracellular staining
Surface and intracellular staining were conducted to analyze T-cell subtypes by three researchers (HT, NI, and SG). After thawing of frozen PBMCs, 2 × 10⁶ cells were prepared for each analysis. Among the 2 × 10⁶ PBMCs, 1 × 10⁶ cells were used to analyze cytotoxic T-lymphocyte (CTL), CD4+ T-cells, and regulatory T cells (Treg). PBMCs were first incubated for surface staining with the following antibodies: CD4 PerCP-Cy5.5 (clone SK3; BD Biosciences, CA, USA), CD8 FITC (clone HIT8a; BD Pharmingen, CA, USA), and CD25 (clone 4E3; Miltenyi Biotec, CA, USA). After washing the cells using phosphate buffered saline with 2% fetal bovine serum, intracellular staining by forkhead/winged helix transcription factor (FoxP3) PE (clone 236A/E7; eBioscience, CA, USA) was done according to instructions provided by the manufacturer (Anti-Human FOXP3 Staining Set PE; eBioscience, CA, USA).
Remaining 1 × 10⁶ PBMCs were used for the analysis of Type-1 (Th1) and Type-2 helper T-cells (Th2). After surface staining with antibodies for CD4 PreCP-Cy5.5, cells were stimulated with 10 ng/ml of phorbol myristate acetate (PMA; Sigma–Aldrich Co. LLC) and 1 ng/ml of ionomycin (Sigma–Aldrich Co. LLC) in the presence of 0.67 µl/ml of protein transport inhibitor containing monensin (BD Golgistop; BD Biosciences) for 4 hr at 37 °C in an atmosphere containing 5% CO2. Then, intracellular staining was done for interferon gamma (IFN-γ) FITC (Clone B27; BD Pharmingen) and interleukin 4 (IL-4) APC (Clone MP4-25D2; BD Pharmingen).
Flow cytometry
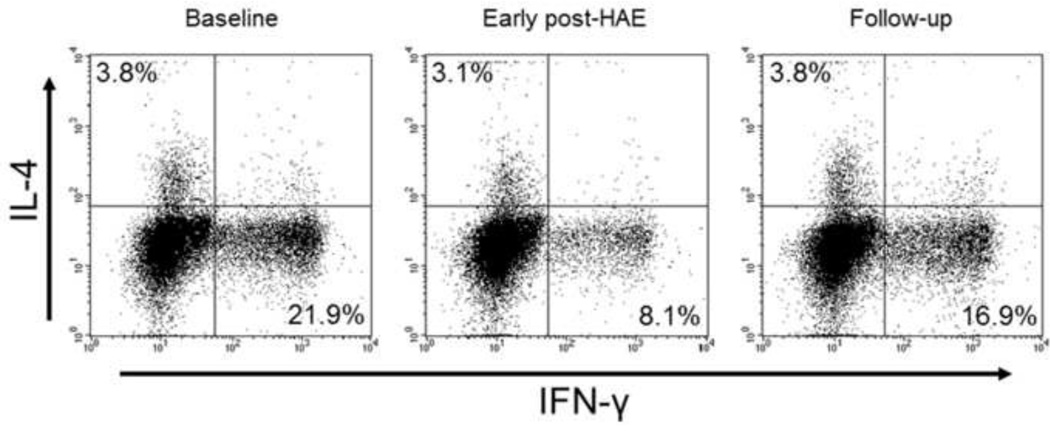
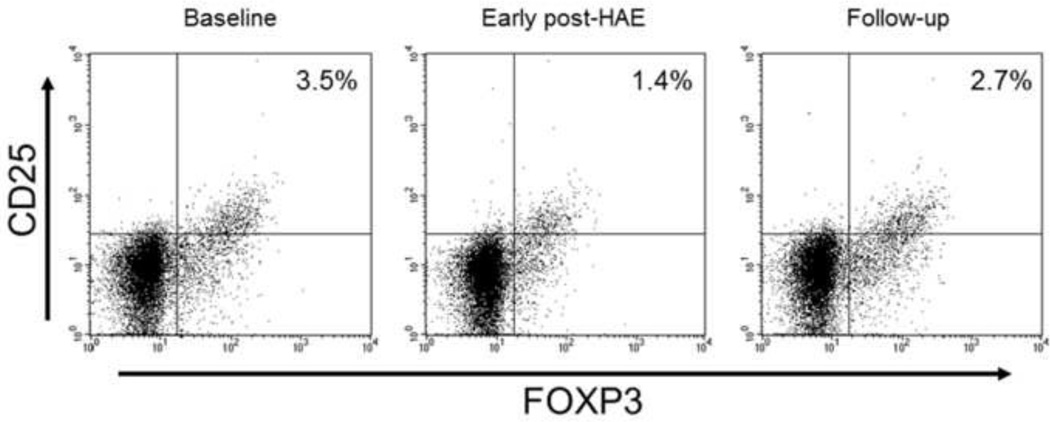
Populations of each T-cell subset were analyzed using flow cytometry (FACSCalibur; Becton, Dickinson and Co.) (Figs. 1,2). After the lymphocyte population was gated from PBMCs according to forward scatter and side scatter characteristics, 20,000 lymphocytes were collected in each sample. Then, CD4+ and CD8+ subsets were gated by referencing the unstained sample. Populations of CD25+FoxP3+, IFN-γ+, and IL-4+ cells were evaluated further using CD4+ gate. Isotype-matched PE-, PerCP-Cy5.5-, APC-, and FITC-conjugated mouse IgG1 antibodies were used as controls (BD Biosciences, BD Pharmingen, and Miltenyi Biotec). All flow cytometry analyses were performed using software (BD CellQuest; Becton, Dickinson and Co.).
Figure 1.
Representative flow cytometry results for a patient who received hepatic artery embolization (HAE) for the treatment of hepatocellular carcinoma. Population of peripheral blood Type-1 helper T-cell (Th1) was decreased (21.9% to 8.1%) in the early post-HAE period. It returned to the baseline level (16.9%) during the follow-up period.
IL-4, interleukin-4; IFN-γ, interferon-gamma
Figure 2.
Representative flow cytometry results of a patient who received hepatic artery embolization (HAE) for the treatment of hepatocellular carcinoma. Population of peripheral blood regulatory T-cell (Treg) was decreased (3.5% to 1.4%) in the early post-HAE period. It returned to the baseline level (2.7%) during the follow-up period.
CD25, cluster of differentiation 25; FOXP3, forkhead box P3
Measurements and statistical analysis
This study evaluated the serial change of peripheral blood WBCs, neutrophils, and lymphocytes after HAE. We also evaluated the percentages of T-cell subtypes including CD8+ CTL, CD4+ T-cells, CD4+CD25+Foxp3+ Treg, CD4+IFN-γ+ Th1, and CD4+IL-4+ Th2.
Data are expressed as mean and standard error (SE). Comparisons of samples between time points were made using paired t tests. If significant changes in T-cell population were found after HAE, factors affecting these changes were also evaluated. Because of variation of the baseline T-cell population, we used fold-change for this evaluation, defined as the post/pre ratio of T-cell population. Comparisons of fold-changes of T-cell subtypes between subgroups (i.e., patient backgrounds, tumor characteristics, characteristics at the time of HAE) were done using Mann–Whitney U tests. All p values less than .05 were inferred as significant. All statistical analyses were conducted using software (SAS, release 9.1; SAS Institute Inc., Cary, NC, USA).
RESULTS
Changes in white blood cell, neutrophil, and lymphocyte counts
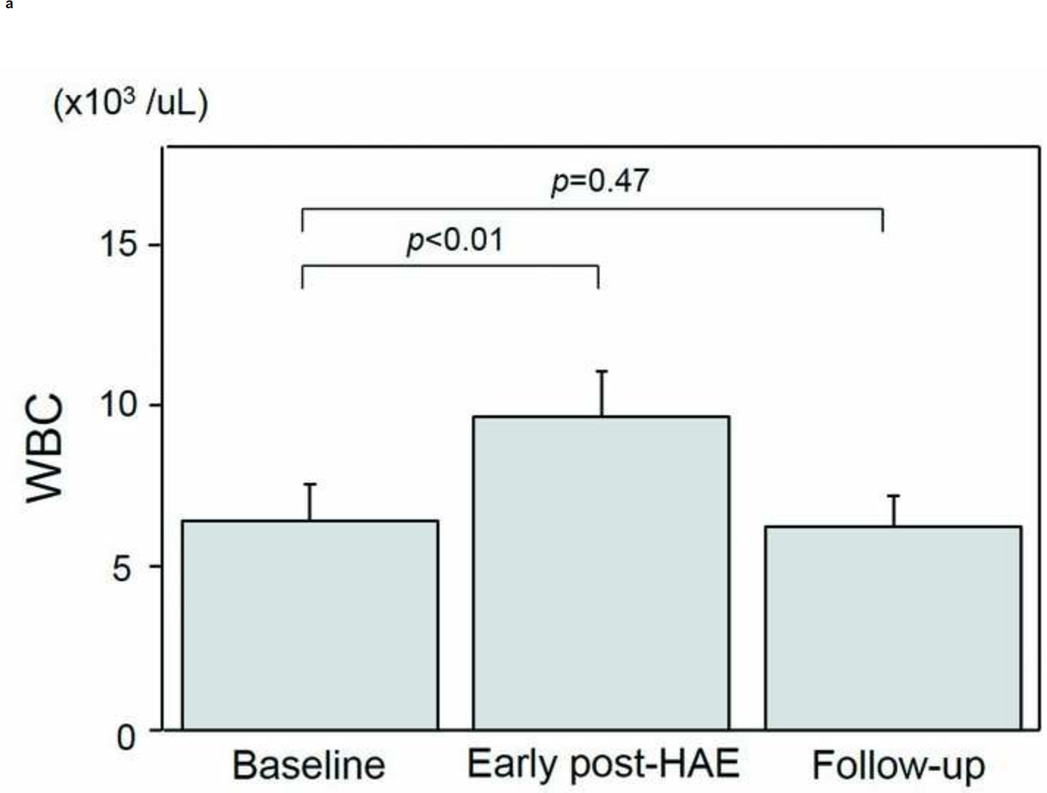
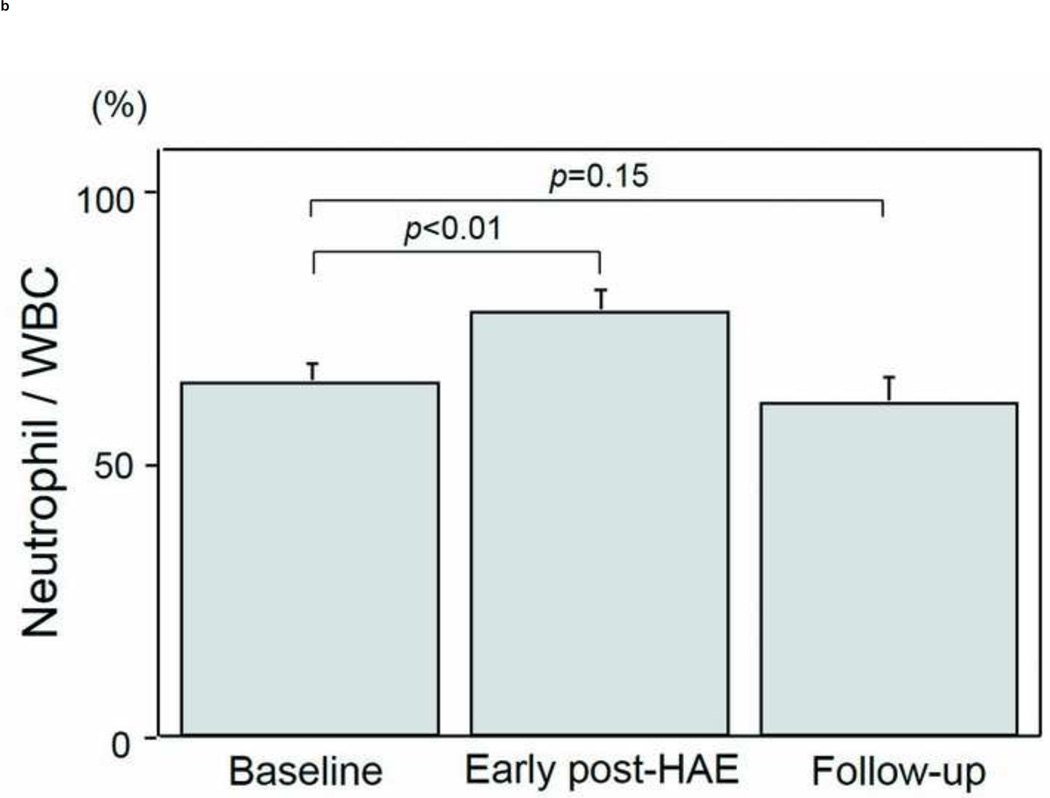
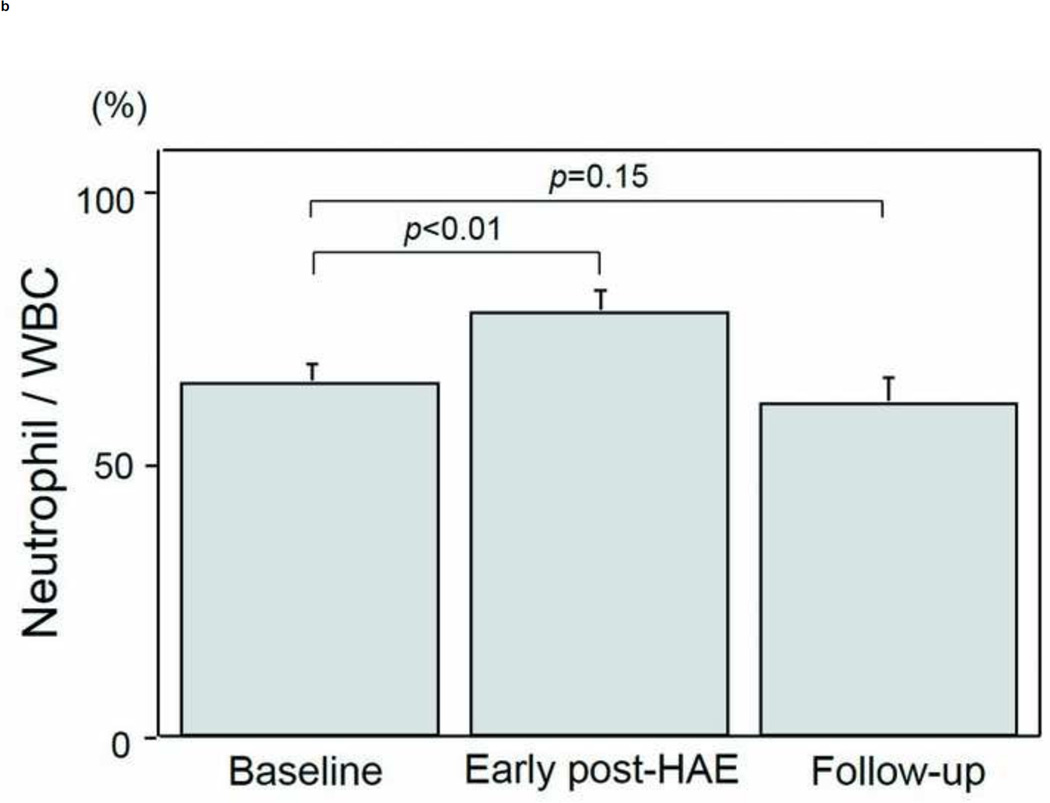
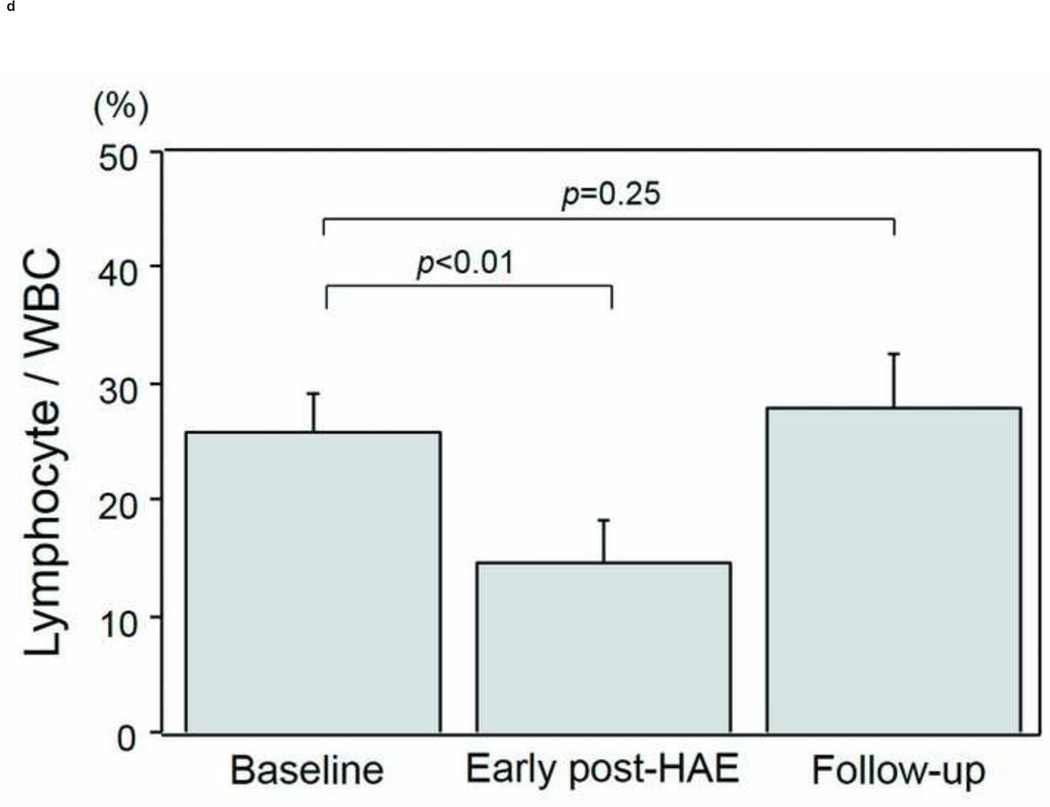
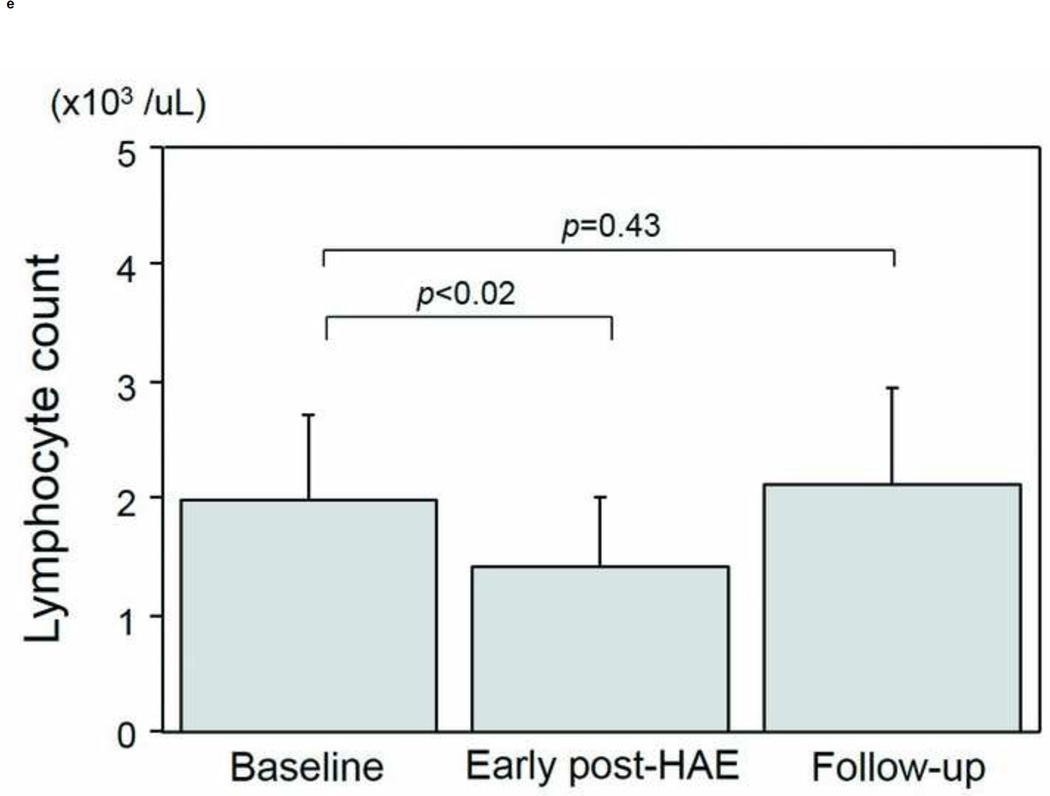
The intervals between HAE and post-HAE blood samplings were 1.2±0.6 days (early post-HAE period; range 1–3 days) and 34.8±14.2 (follow-up period; range 14–62 days), respectively. Changes in WBC, neutrophil, and lymphocyte counts are presented in Figs. 3a–3e. WBC counts (6.5 ± 1.1 to 9.6 ± 1.4 ×10³/µL, p < .01), neutrophil populations (63.9 ± 3.5 to 77.2 ± 3.7%, p < .01), and neutrophil counts (3.8 ± 0.4 to 7.5 ± 1.1 ×10³/µL, p < .01) increased significantly during the early post-HAE period (Figs. 3a–3c). Lymphocyte populations (25.7 ± 3.5 to 14.7 ± 3.5%, p < .01) and counts (2.0 ± 0.7 to 1.4±0.6 ×10³/µL, p < .02) decreased significantly during the early post-HAE period (Figs. 3d, 3e). All of those changes returned to baseline levels during the follow-up period (Figs. 3a–3e).
Figure 3.
Changes in white blood cells (WBC), neutrophils, and lymphocytes after hepatic artery embolization (HAE). (a) WBC, (b) population of neutrophils in WBC, (c) neutrophil count, (d) population of lymphocyte in WBC, and (e) neutrophil count in peripheral blood sample. Data are expressed as the mean and standard error.
Changes in T-cell population
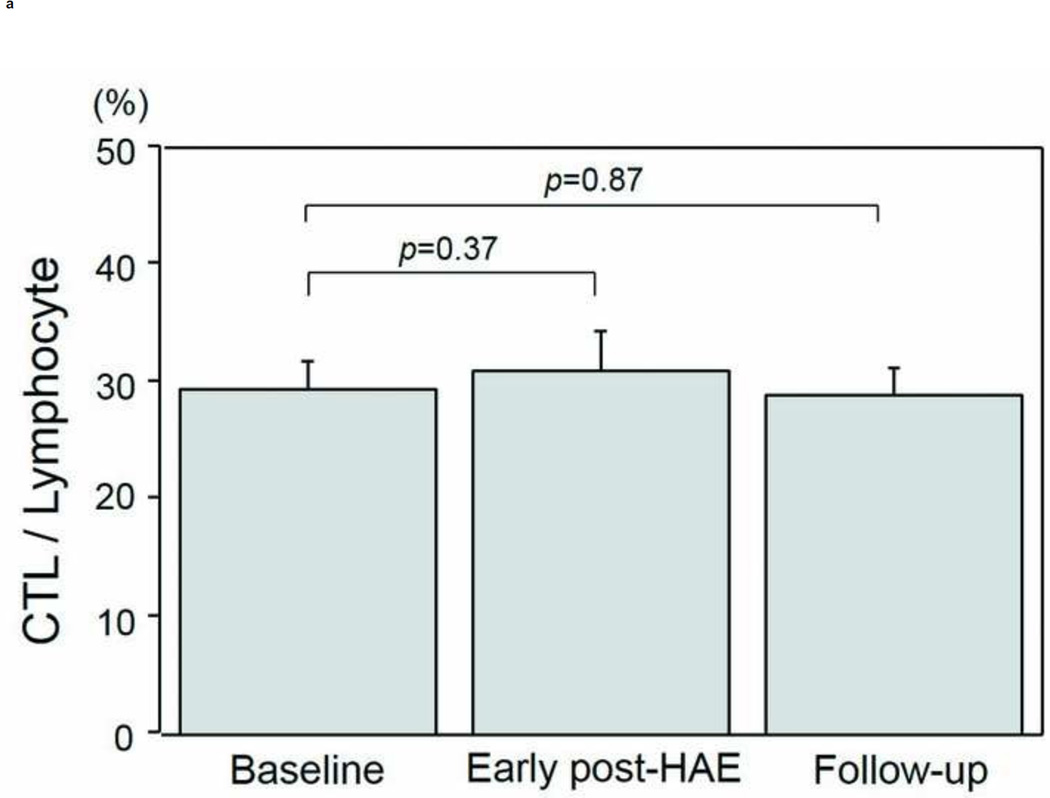
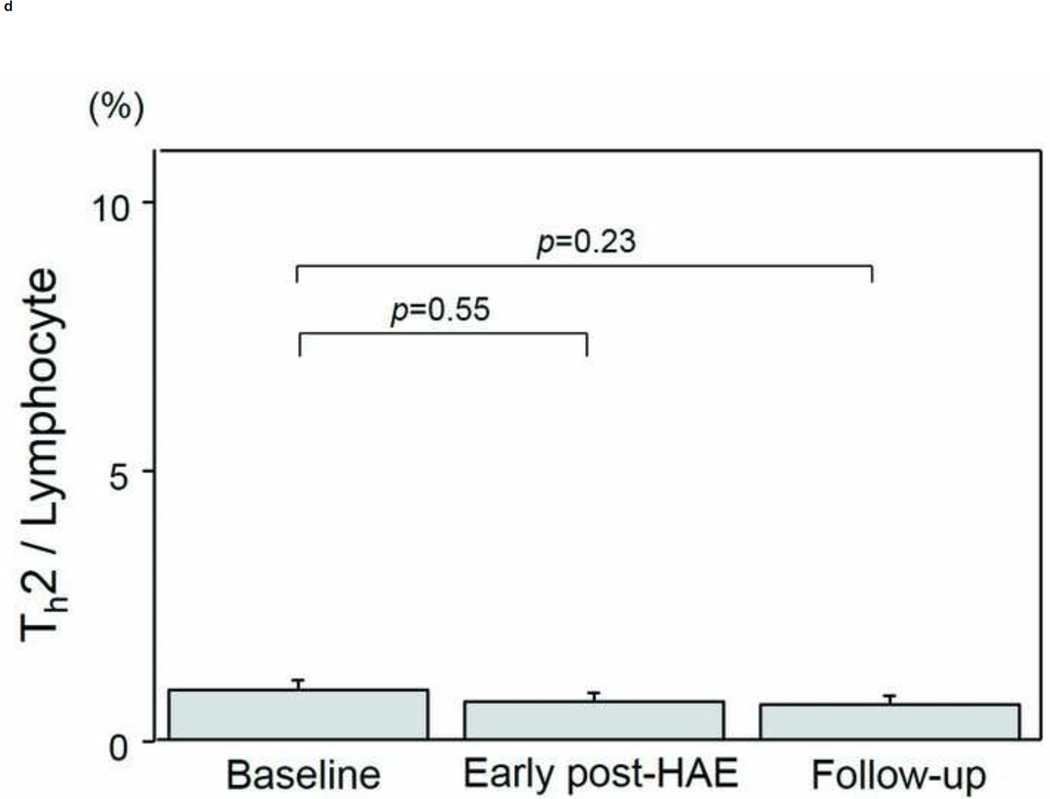
Changes in the populations of T-cell subtypes are presented in Figs. 4a–4e. A significant decrease of CD4+ T-cell population was found in both the early post-HAE period (44.0±2.2 to 34.4±3.6%, p< .01) and the follow-up periods (44.0±2.2 to 36.3±3.0%, p< .01) (Fig. 4b). Among the individual CD4+ T-cell subtypes, Treg (2.5±0.3 to 1.7±0.2%, p< .02) and Th1 (8.1±1.8 to 5.6±1.6%, p< .02) populations decreased significantly in the early post-HAE period (Figs. 4c, 4e). However, no significant change was observed in any population of CTL and Th2 (Figs. 4a, 4e).
Figure 4.
Changes in T-cell population after hepatic artery embolization (HAE). Populations of (a) cytotoxic T-cells (CTL), (b) CD4+ T-cells, (c) type-1 helper T-cell (Th1), (d) type-2 helper T-cells (Th2), and (e) regulatory T-cells (Treg) in peripheral blood lymphocyte. Data are expressed as the mean and standard error.
Factors affecting fold-changes of Treg and Th1 were also evaluated (Table 2). The presence of extrahepatic disease was associated with decreasing Treg population in early post-HAE periods (p< .04).
Table 2.
Factors affecting fold change of Treg and Th1 population
| Early post-HAE period | Follow-up period | |||||||
|---|---|---|---|---|---|---|---|---|
| Parameter | Fold change (Treg) |
p value |
Fold change (Th1) |
p value |
Fold change (Treg) |
p value |
Fold change (Th1) |
p value |
| Age (years) | .46 | .83 | .68 | .68 | ||||
| ≤60 | 0.65±0. 15 |
0.70±0. 12 |
0.74±0. 25 |
1.00±0. 22 |
||||
| >60 | 0.83±0. 15 |
0.77±0. 10 |
0.88±0. 34 |
0.85±0. 10 |
||||
| Gender | .12 | > .99 | .23 | .93 | ||||
| Male | 0.81±0. 13 |
0.72±0. 10 |
0.93±0. 72 |
0.95±0. 19 |
||||
| Female | 0.47±0. 08 |
0.77±0. 13 |
0.39±0. 19 |
0.91±0. 18 |
||||
| Primary diagnosis | .22 | .20 | .57 | .81 | ||||
| HCC | 0.89±0. 17 |
0.88±0. 12 |
0.75±0. 34 |
0.93±0. 22 |
||||
| Other | 0.60±0. 12 |
0.63±0. 09 |
0.83±0. 25 |
0.94±0. 18 |
||||
| Child-Pugh score | > .99 | .60 | > .99 | > .99 | ||||
| 5 | 0.71±0. 11 |
0.73±0. 10 |
0.73±0. 18 |
0.93±0. 16 |
||||
| 6 or more | 0.79±0. 42 |
0.73±0. 18 |
1.12±0. 95 |
0.95±0. 03 |
||||
| Tumor number | > .99 | .60 | > .99 | > .99 | ||||
| Single | 0.79±0. 42 |
0.73±0. 18 |
1.12±0. 95 |
0.98±0. 03 |
||||
| Multiple | 0.72±0. 11 |
0.73±0. 8 |
0.80±0. 19 |
0.94±0. 13 |
||||
| Maximum tumor diameter (cm) |
.52 | .43 | .52 | .78 | ||||
| ≤5 | 0.76±0. 13 |
0.70±0. 09 |
0.90±0. 24 |
0.89±0. 14 |
||||
| >5 | 0.62±0. 19 |
0.85±0. 21 |
0.48±0. 23 |
1.08±0. 37 |
||||
| Extrahepatic lesion | < .04 * |
.06 | .34 | .87 | ||||
| No | 0.95±0. 13 |
0.86±0. 08 |
0.90±0. 26 |
0.98±0. 17 |
||||
| Yes | 0.49±0. 10 |
0.53±0. 09 |
0.69±0. 31 |
0.90±0. 22 |
||||
| Range of HAE | .61 | .39 | .23 | .17 | ||||
| Lobar | 0.74±0. 13 |
0.76±0. 13 |
0.55±0. 11 |
0.80±0. 16 |
||||
| Segmental | 0.69±0. 20 |
0.69±0. 08 |
1.28±0. 49 |
1.20±0. 17 |
||||
| Maximum AST after HAE (IU/l) |
.42 | .20 | .15 | .26 | ||||
| ≤100 | 0.62±0. 35 |
0.63±0. 09 |
0.96±0. 25 |
1.08±0. 18 |
||||
| >100 | 0.82±0. 16 |
0.88±0. 12 |
0.63±0. 31 |
0.84±0. 20 |
||||
| Initial therapeutic response on mRECIST |
.64 | .30 | .64 | .17 | ||||
| CR or PR | 0.70±0. 14 |
0.70±0. 09 |
0.73±0. 20 |
0.81±0. 11 |
||||
| SD or PD | 0.80±0. 10 |
0.87±0. 19 |
1.01±0. 58 |
1.31±0. 38 |
||||
Data are presented as median and standard error (SE). HAE, hepatic artery embolization; HCC, hepatocellular carcinoma; mRECIST, modified response evaluation criteria in solid tumors; CR, complete response; PR, partial response; SD, stable disease; PD, progressive disease
p< .05 as compared with baseline
DISCUSSION
Results of our study have demonstrated that peripheral blood lymphocytes decrease and that neutrophils increase in early post-HAE periods. This change, which is commonly observed after HAE, reflects systemic inflammatory change (16). It is more interesting that results of our study verified the hypothesis that HAE can alter the peripheral blood T-cell environment.
In this study, the peripheral blood Treg population decreased after HAE. Treg is a T-cell subtype that maintains self-tolerance and homeostasis in the immune system (17). Results of several studies show that the tumor microenvironment can promote Treg induction and recruitment (18), and show that the frequency of peripheral Treg increases with tumor progression (19,20). The Treg population is known to correlate with the tumor burden (19,20). Therefore, the decrease of Treg population after HAE observed in this study might simply reflect the decrease of the tumor burden. Another explanation of the Treg decrease might be the altered cytokine environment. Previous studies have reported that a robust increase of IL-6 was observed in the early post-HAE period (6–8). Reportedly, IL-6 inhibits transforming growth-factor-β-induced Treg differentiation (21).
In cancer patients, Treg is known to suppress anti-tumor immune response. Increased Treg population is associated with poorer prognosis (22–25). Therefore, a decrease in the Treg population might benefit the enhancement of systemic anti-tumor immunity. Indeed, various laboratory and clinical reports have described that Treg depletion increase systemic antitumor effects (26,27).
Th1 is another subtype of T-cell which enhances antitumor immune response by secreting IFN-γ and activating CTL. Therefore, a decrease of Th1 can negatively affect antitumor immunity. In this study, peripheral blood Th1 population also decreased after HAE. The decrease of Th1 population might also be related to the cytokine environment. Differentiation of Th1 from naïve T-cells is inhibited by IL-6 (28). Therefore, increased IL-6 after HAE might engender the decrease of the peripheral blood Th1 population, although further studies must be conducted to confirm this hypothesis.
It is noteworthy that altered populations of lymphocyte and T-cell subtypes in the early post-HAE period returned to the baseline levels in the follow-up period. This phenomenon might also be related to the cytokine environment. Previous reports have described that elevated IL-6 levels returned to the baseline at 1 month after embolization (6).
Given that the decrease of Treg population was transient and that the Th1 population also decreased in this study, HAE might affect the systemic antitumor immune response both positively and negatively. Indeed, spontaneous regression of extra-hepatic metastasis is rarely observed after HAE (29). However, results of this study suggest an adjuvant approach to enhance antitumor effects. Systemic antitumor immune response after HAE might be reinforced if adjuvant therapies which sustain Treg decrease and simultaneously boost Th1 response could be combined. Previous reports have described that Th1 response enhancement and Treg depletion increase antitumor effects (26,27,30).
This study has several limitations that include the small number of enrolled patients, the high drop-out rate of enrolled patients, the heterogeneous patient backgrounds and HAE technique, the lack of a control group, and short follow-up periods. Moreover, the time points of blood sampling were limited and timing was wide ranged especially during the follow-up period. This variation might confound study results. However, the primary purpose of this study was to report preliminary data of changes in T-cell subtypes after HAE. Additional research with a stricter schedule of blood sampling must be undertaken to confirm the results of this study. Third, we only evaluated peripheral blood T-cells; those in the tumor microenvironment were not evaluated. Fourth, although minor comorbidities such as the common cold might also affect peripheral blood T-cell populations, effects of such comorbidities were not examined closely. Fifth, we did not evaluate the antigen-specific T-cell response. Therefore, it remains unclear if changes in T-cell populations observed in this study reflect antigen-specific T-cell response. Finally, we only evaluated changes in the peripheral blood T-cell subtypes after HAE. Relations with tumor progression and patient prognosis were not evaluated. Therefore, the clinical relevance of T-cell changes observed in this study remains unclear. Despite these limitations, results of our study yielded useful preliminary data for changes in T-cell subtypes after HAE.
In conclusion, HAE can alter the peripheral blood T-cell environment by decreasing both Treg and Th1 populations.
Footnotes
Publisher's Disclaimer: This is a PDF file of an unedited manuscript that has been accepted for publication. As a service to our customers we are providing this early version of the manuscript. The manuscript will undergo copyediting, typesetting, and review of the resulting galley proof before it is published in its final citable form. Please note that during the production process errors may be discovered which could affect the content, and all legal disclaimers that apply to the journal pertain.
No author has any conflict of interest related to this study.
REFERENCES
- 1.Covey AM, Maluccio MA, Schubert J, et al. Particle embolization of recurrent hepatocellular carcinoma after hepatectomy. Cancer. 2006;106:2181–2189. doi: 10.1002/cncr.21883. [DOI] [PubMed] [Google Scholar]
- 2.Maluccio MA, Covey AM, Schubert J, et al. Treatment of metastatic sarcoma to the liver with bland embolization. Cancer. 2006;107:1617–1623. doi: 10.1002/cncr.22191. [DOI] [PubMed] [Google Scholar]
- 3.Mizukoshi E, Nakamoto Y, Arai K, et al. Enhancement of tumor-specific T-cell responses by transcatheter arterial embolization with dendritic cell infusion for hepatocellular carcinoma. Int J Cancer. 2010;126:2164–2174. doi: 10.1002/ijc.24882. [DOI] [PubMed] [Google Scholar]
- 4.Flecken T, Schmidt N, Hild S, et al. Immunodominance and functional alterations of tumor-associated antigen-specific CD8+ T-cell responses in hepatocellular carcinoma. Hepatology. 2014;59:1415–1426. doi: 10.1002/hep.26731. [DOI] [PMC free article] [PubMed] [Google Scholar]
- 5.Kim MJ, Jang JW, Oh BS, et al. Change in inflammatory cytokine profiles after transarterial chemotherapy in patients with hepatocellular carcinoma. Cytokine. 2013;64:516–522. doi: 10.1016/j.cyto.2013.07.021. [DOI] [PubMed] [Google Scholar]
- 6.Erinjeri JP, Thomas CT, Samoila A, et al. Interleukin-6 fold change following hepatic artery embolization predicts length of hospital stay. J Vasc Interv Radiol. 2014;25:S114. [Google Scholar]
- 7.Ikei S, Ogawa M, Beppu T, et al. Changes in IL-6, IL-8, C-reactive protein and pancreatic secretory trypsin inhibitor after transcatheter arterial chemo-embolization therapy for hepato-cellular carcinoma. Cytokine. 1992;4:581–584. doi: 10.1016/1043-4666(92)90023-k. [DOI] [PubMed] [Google Scholar]
- 8.Matsuda Y, Kawata S, Nagase T, et al. Interleukin-6 in transcatheter arterial embolization for patients with hepatocellular carcinoma. Effects of serine protease inhibitor. Cancer. 1994;73:53–57. doi: 10.1002/1097-0142(19940101)73:1<53::aid-cncr2820730111>3.0.co;2-w. [DOI] [PubMed] [Google Scholar]
- 9.Angell H, Galon J. From the immune contexture to the Immunoscore: The role of prognostic and predictive immune markers in cancer. Curr Opin Immunol. 2013;25:261–267. doi: 10.1016/j.coi.2013.03.004. [DOI] [PubMed] [Google Scholar]
- 10.Han S, Zhang C, Li Q, et al. Tumour-infiltrating CD4+ and CD8+ lymphocytes as predictors of clinical outcome in glioma. Br J Cancer. 2014;110:2560–2568. doi: 10.1038/bjc.2014.162. [DOI] [PMC free article] [PubMed] [Google Scholar]
- 11.Preston CC, Maurer MJ, Oberg AL, et al. The ratios of CD8+ T cells to CD4+CD25+FOXP3+ and FOXP3− T cells correlate with poor clinical outcome in human serous ovarian cancer. PLoS One. 8:e80063. doi: 10.1371/journal.pone.0080063. 201314. [DOI] [PMC free article] [PubMed] [Google Scholar]
- 12.Ito N, Nakamura H, Tanaka Y, Ohgi S. Lung carcinoma: analysis of T helper type 1 and 2 cells and T cytotoxic type 1 and 2 cells by intracellular cytokine detection with flow cytometry. Cancer. 1999;85:2359–2367. [PubMed] [Google Scholar]
- 13.Ubukata H, Motohashi G, Tabuchi T, Nagata H, Konishi S, Tabuchi T. Evaluations of interferon-γ/interleukin-4 ratio and neutrophil/lymphocyte ratio as prognostic indicators in gastric cancer patients. J Surg Oncol. 2010;102:742–747. doi: 10.1002/jso.21725. [DOI] [PubMed] [Google Scholar]
- 14.Shen Z, Zhou S, Wang Y, et al. Higher intratumoral infiltrated Foxp3+ Treg numbers and Foxp3+/CD8+ ratio are associated with adverse prognosis in resectable gastric cancer. J Cancer Res Clin Oncol. 2010;136:1585–1595. doi: 10.1007/s00432-010-0816-9. [DOI] [PubMed] [Google Scholar]
- 15.Gajewski TF, Schreiber H, Fu YX. Innate and adaptive immune cells in the tumor microenvironment. Nat Immunol. 2013;14:1014–1022. [Google Scholar]
- 16.Huang ZL, Luo J, Chen MS, Li JQ, Shi M. Blood neutrophil-to-lymphocyte ratio predicts survival in patients with unresectable hepatocellular carcinoma undergoing transarterial chemoembolization. J Vasc Interv Radiol. 2011;22:702–709. doi: 10.1016/j.jvir.2010.12.041. [DOI] [PubMed] [Google Scholar]
- 17.Sakaguchi S, Miyara M, Costantino CM, Hafler DA. FOXP3+ regulatory T cells in the human immune system. Nat Rev Immunol. 2010 Jul;10(7):490–500. doi: 10.1038/nri2785. Epub 2010 Jun 18. Review. PubMed PMID: 20559327. [DOI] [PubMed] [Google Scholar]
- 18.Zou W. Immunosuppressive networks in the tumour environment and their therapeutic relevance. Nat Rev Cancer. 2005;5:263–274. doi: 10.1038/nrc1586. [DOI] [PubMed] [Google Scholar]
- 19.Fu J, Xu D, Liu Z, et al. Increased regulatory T cells correlate with CD8 T-cell impairment and poor survival in hepatocellular carcinoma patients. Gastroenterology. 2007;132(7):2328–2339. doi: 10.1053/j.gastro.2007.03.102. Epub 2007 Apr 14. PubMed PMID: 17570208. [DOI] [PubMed] [Google Scholar]
- 20.Zhou L, Fu JL, Lu YY, et al. Regulatory T cells are associated with post-cryoablation prognosis in patients with hepatitis B virus-related hepatocellular carcinoma. J Gastroenterol. 2010;45(9):968–978. doi: 10.1007/s00535-010-0243-3. [DOI] [PubMed] [Google Scholar]
- 21.Kimura A, Kishimoto T. IL-6: regulator of Treg/Th17 balance. Eur J Immunol. 2010;40:1830–1835. doi: 10.1002/eji.201040391. [DOI] [PubMed] [Google Scholar]
- 22.Curiel TJ, Coukos G, Zou L, et al. Specific recruitment of regulatory T cells in ovarian carcinoma fosters immune privilege and predicts reduced survival. Nat Med. 2004;10:942–949. doi: 10.1038/nm1093. [DOI] [PubMed] [Google Scholar]
- 23.Bates GJ, Fox SB, Han C, et al. Quantification of regulatory T cells enables the identification of high risk breast cancer patients and those at risk of late relapse. J Clin Oncol. 2006;24:5373–5380. doi: 10.1200/JCO.2006.05.9584. [DOI] [PubMed] [Google Scholar]
- 24.Sasada T, Kimura M, Yoshida Y, Kanai M, Takabayashi A. CD4+CD25+ regulatory T cells in patients with gastrointestinal malignancies: possible involvement of regulatory T cells in disease progression. Cancer. 2003;98:1089–1099. doi: 10.1002/cncr.11618. [DOI] [PubMed] [Google Scholar]
- 25.Sato E, Olson SH, Ahn J, et al. Intraepithelial CD8+ tumor-infiltrating lymphocytes and a high CD8+/regulatory T cell ratio are associated with favorable prognosis in ovarian cancer. Proc Natl Acad Sci USA. 2005;102:18538–18543. doi: 10.1073/pnas.0509182102. [DOI] [PMC free article] [PubMed] [Google Scholar]
- 26.Sugiyama D, Nishikawa H, Maeda Y, et al. Anti-CCR4 mAb selectively depletes effector-type FoxP3+CD4+ regulatory T cells, evoking antitumor immune responses in humans. Proc Natl Acad Sci USA. 2013;110:17945–17950. doi: 10.1073/pnas.1316796110. [DOI] [PMC free article] [PubMed] [Google Scholar]
- 27.Rech AJ, Mick R, Martin S, et al. CD25 blockade depletes and selectively reprograms regulatory T cells in concert with immunotherapy in cancer patients. Sci Transl Med. 2012;4:134. doi: 10.1126/scitranslmed.3003330. [DOI] [PMC free article] [PubMed] [Google Scholar]
- 28.Diehl S, Rincón M. The two faces of IL-6 on Th1/Th2 differentiation. Mol Immunol. 2002;39:531–536. doi: 10.1016/s0161-5890(02)00210-9. [DOI] [PubMed] [Google Scholar]
- 29.Heianna J, Miyauchi T, Suzuki T, Ishida H, Hashimoto M, Watarai J. Spontaneous regression of multiple lung metastases following regression of hepatocellular carcinoma after transcatheter arterial embolization. A case report. Hepatogastroenterology. 2007;54:1560–1562. [PubMed] [Google Scholar]
- 30.Xu HM. Th1 cytokine-based immunotherapy for cancer. Hepatobiliary Pancreat Dis Int. 2014;13:482–494. doi: 10.1016/s1499-3872(14)60305-2. [DOI] [PubMed] [Google Scholar]


