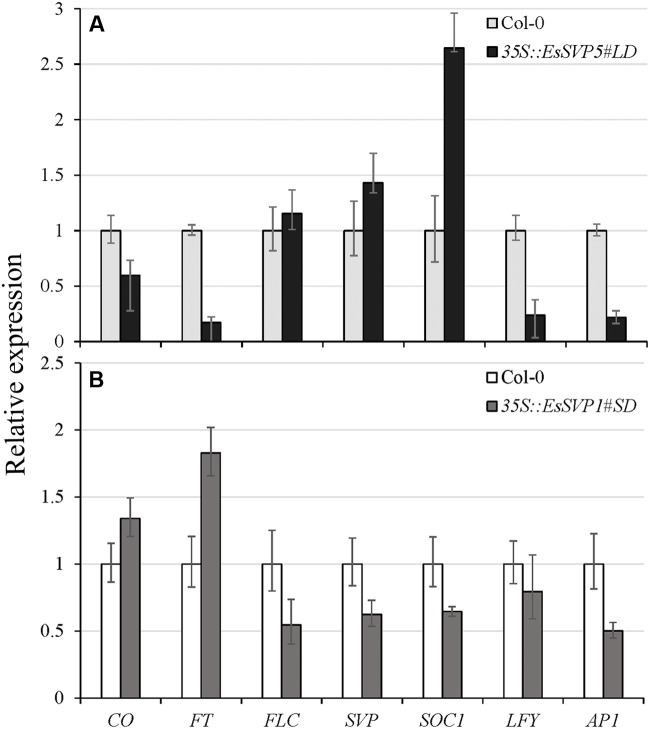
FIGURE 5.
Relative expression levels of different flowering time genes (CO, FT, FLC, SVP, SOC1, LFY, and AP1) in 35S::EsSVP 5#LD and 1#SD transgenic Arabidopsis as determined by qRT-PCR, with the TUBULIN2 gene as an internal control. 35S::EsSVP 5#LD (A) and 1#SD (B) under LD and SD condition, respectively. Error bars indicate the SD of the average of relative mRNA amounts determined as triplicates in two independent biological replicates.

