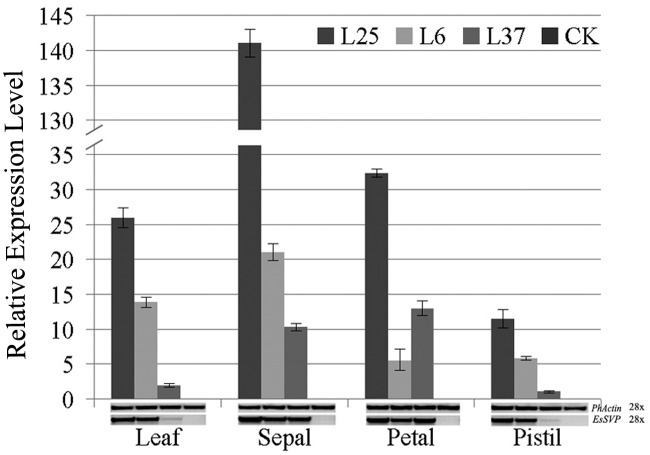
FIGURE 7.
RT and qRT-PCR on leaves, sepals, petals and pistils of 35S::EsSVP Petunia. Error bars represent standard deviations calculated from three replications. The PhActin homolog gene of Petunia was used as an internal control. The number of PCR cycles is indicated next to the gene names. Different transgenic lines (L25, strong; L6, medium; L37, weak) were selected according to the strength of phenotype. WT indicates wild type W115.

