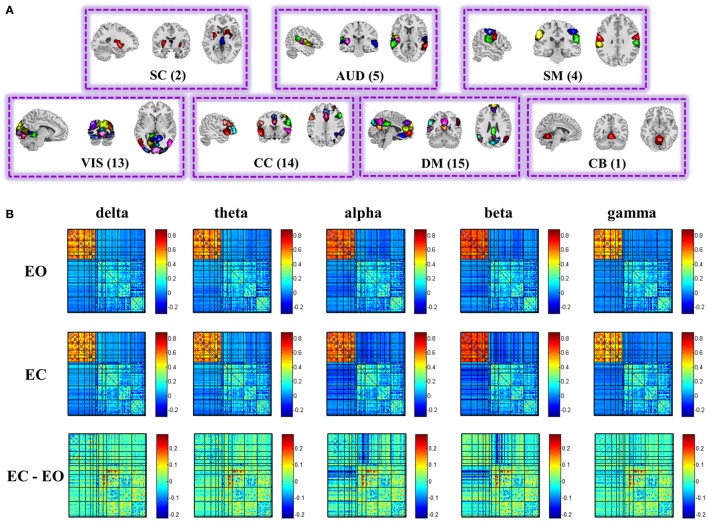
Figure 2.
Spatial maps of the 54 ICs (A), and structure of the group mean static EEG-fMRI brain graphs in the five frequency bands for eyes open, eyes closed, and difference between eyes conditions (B). Both positive and negative correlations of the correlation matrix are shown in this figure. See Figure S6 for the nodes organization. (EO, eyes open; EC, eyes closed; SC, sub-cortical; AUD, auditory; SM, somatomotor; VIS, visual; CC, cognitive control; DM, default-mode; CB, cerebellar).

