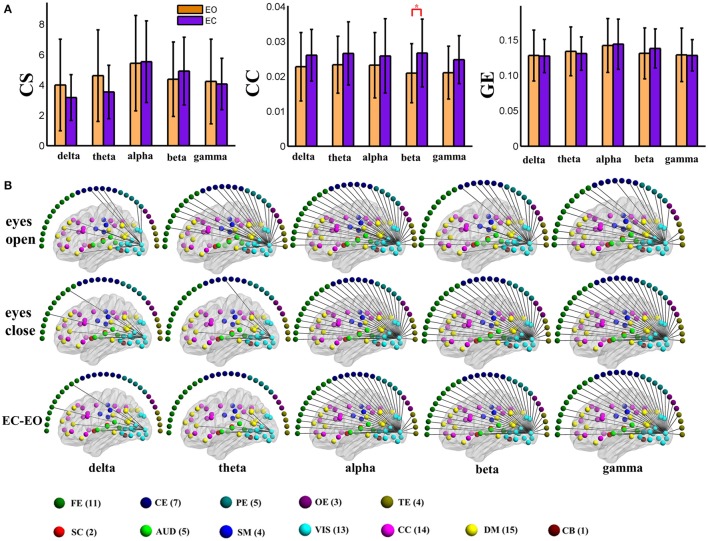
Figure 4.
(A) Graph metrics of a visual component node in the static negative connection graph. Connectivity strength is indicated on the left, the clustering coefficient is indicated in the middle, and global efficiency is indicated on the right. The bar color indicates the eyes (open vs. closed) condition and the bar height indicates the mean value of the measurement for the 25 subjects. Error bars correspond to standard deviations. The main effect of the eyes condition is significant for CC (FDR correction, q < 0.001), with higher values during eyes closed than during eyes open. (“*” indicates P < 0.05 for post-hoc paired t-test). (B) Patterns of connections from one visual component node to other nodes are indicated for the different frequency bands and conditions. The graphs are plotted using the same threshold across all 5 frequency bands in eyes open, eyes closed or the difference between the two conditions. Only positive connections are shown in the graphs of difference between conditions. Color dots inside the brain map indicate fMRI brain components. Color dots outside the brain map indicate EEG electrodes. (CS, connectivity strength; CC, clustering coefficient; GE, global efficiency; EC, eyes closed; EO, eyes open; FE, frontal electrodes; CE, central electrodes; PE, parietal electrodes; OE, occipital electrodes; TE, temporal electrodes).

