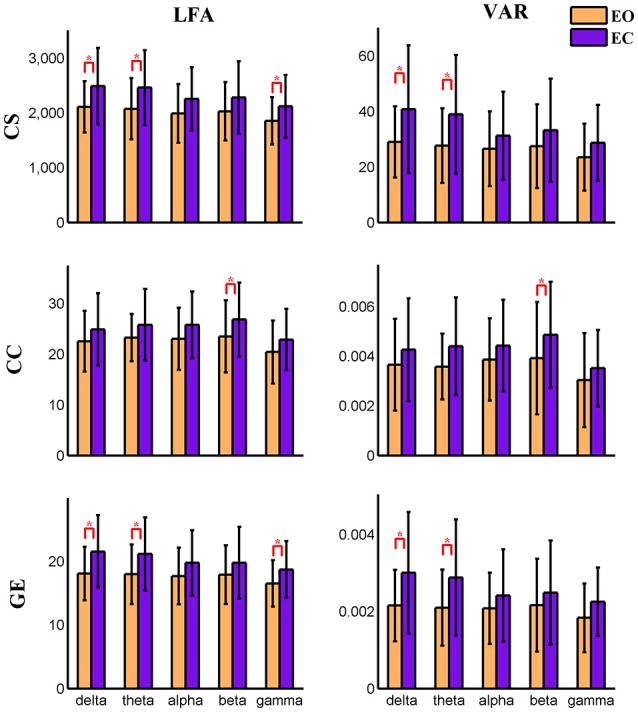
Figure 7.

Amplitude of low frequency (LFA) and variance (VAR) of the time series of three graph measures of a visual component node in time-varying positive connection graphs. The bar color indicates the eyes condition and the bar height indicates the mean value of VAR or LFA for the 25 subjects. Error bars correspond to standard deviations. The main effect of eyes condition is significant (FDR correction, q < 0.001) for LFA and VAR of CS and GE. Values of VAR and LFA are higher in eyes closed than in eyes open and paired t-tests show significant difference between eyes open and eyes closed for CS and GE mainly in delta and theta bands. The main effect of frequency band is not significant for any measure. (“*” indicates P < 0.05 for paired t-test; CS, connectivity strength; CC, clustering coefficient; GE, global efficiency).
