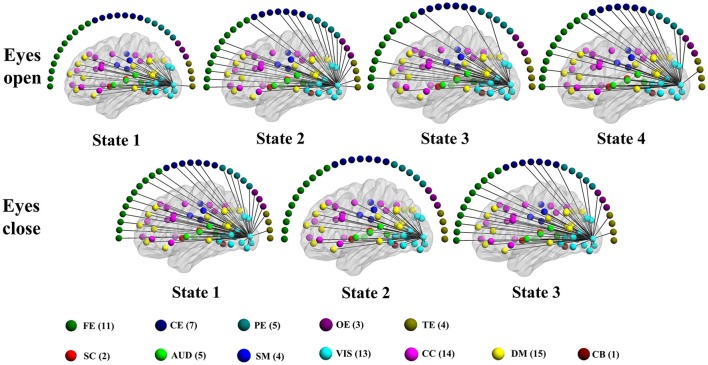
Figure 9.
Patterns of connections from a visual component node to all other graph nodes for the connectivity states identified in an example subject in the alpha band for time-varying positive connection graphs. Color dots inside the brain map indicate the approximate centroid location of fMRI brain components. Color dots outside the brain map indicate EEG electrodes. (FE, frontal electrodes; CE, central electrodes; PE, parietal electrodes; OE, occipital electrodes; TE, temporal electrodes).

