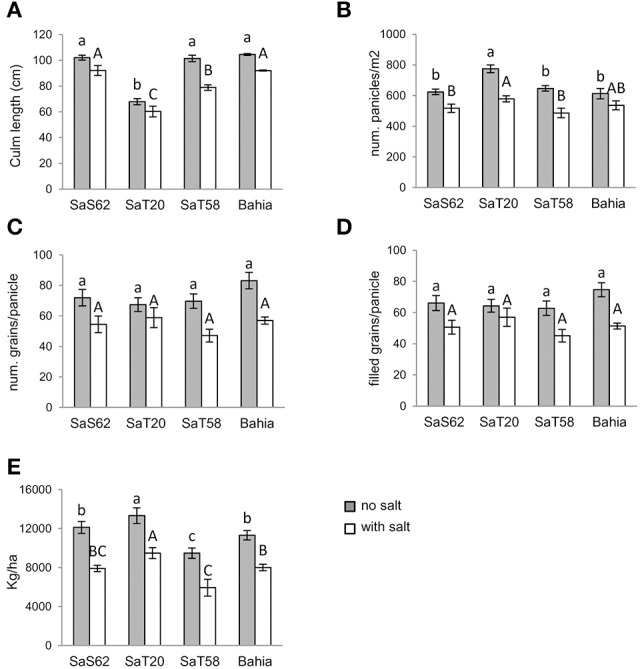
Figure 2.

Mean and standard errors of (A) height, (B) number of panicle per square meter, (C) number of grains per panicle, and (D) number of filled grains per panicle and (E) yield of plants grown in fields under non-salt (solid bars) and salt (open bars) conditions. The same letter in bars within each genotype indicates no significant difference at 0.05 significance level based on Duncan's multiple range test. Upper case letters refer to non-salt treatment, while lower case letters refer to salt treatment.
