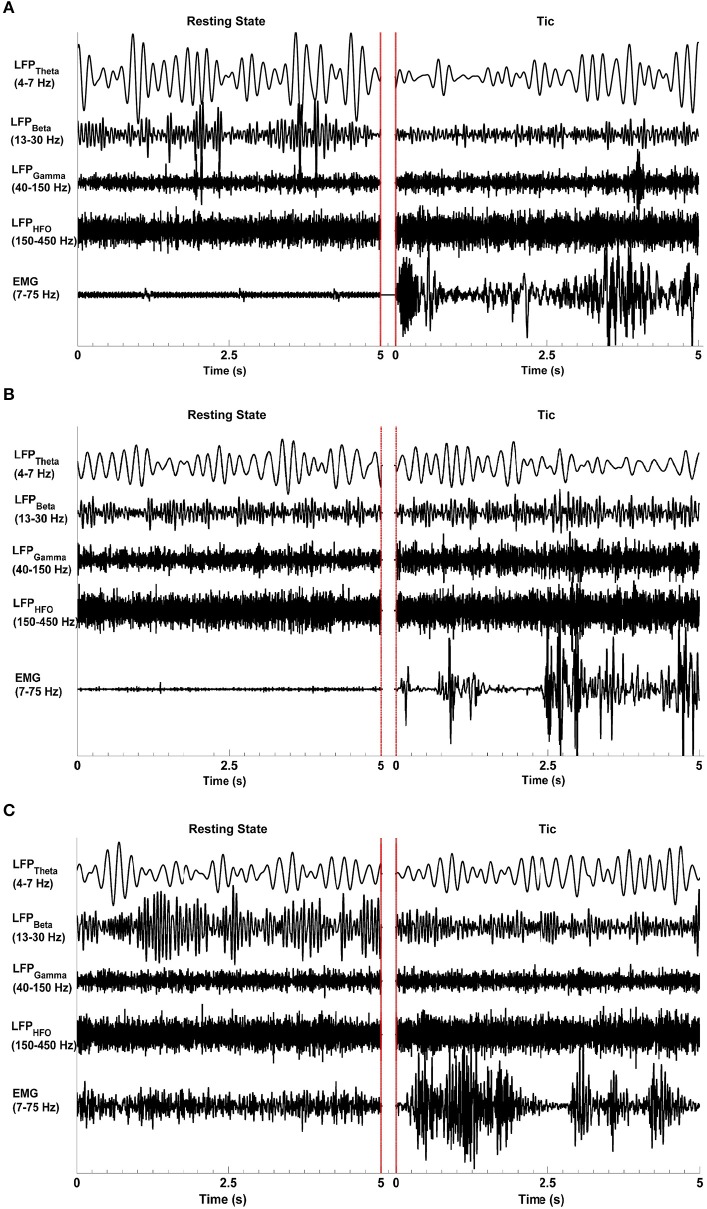
Figure 1.
Representative LFP signal characteristics during the resting state and tics. Epochs of each state lasting 5 s are presented, separated by red lines. The raw LFP data was bandpass filtered at the theta (4–7 Hz), beta (13–30 Hz), gamma (40–150 Hz), and high frequency oscillation (HFO, 150–500 Hz) ranges. The EMG signals were filtered between 7 and 75 Hz. Event-related desynchronization and synchronization are evident in Subjects I (A) and III (C) but not in Subject II (B). All subjects demonstrate a clear increase in EMG activity during tics compared to the resting state. The red lines indicate the end of one epoch and the beginning of another.

