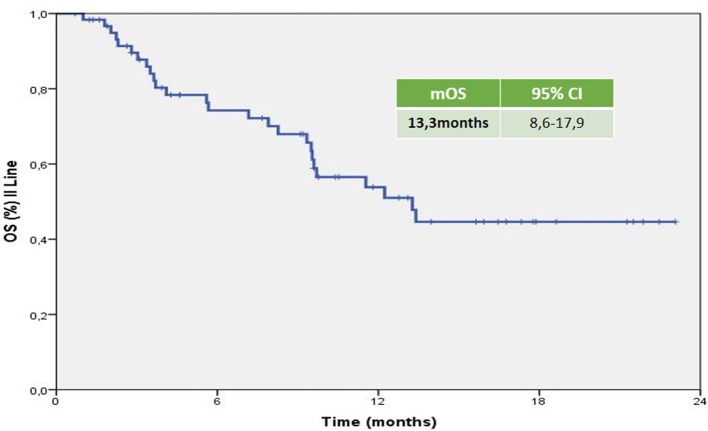
. 2016 Sep 28;7:331. doi: 10.3389/fphar.2016.00331
Copyright © 2016 D'Aniello, Vitale, Farnesi, Calvetti, Laterza, Cavaliere, Della Pepa, Conteduca, Crispo, De Vita, Grillone, Ricevuto, De Tursi, De Vivo, Di Napoli, Cecere, Iovane, Amore, Piscitelli, Quarto, Pisconti, Ciliberto, Maiolino, Muto, Perdonà, Berretta, Naglieri, Galli, Cartenì, De Giorgi, Pignata, Facchini and Rossetti.
This is an open-access article distributed under the terms of the Creative Commons Attribution License (CC BY). The use, distribution or reproduction in other forums is permitted, provided the original author(s) or licensor are credited and that the original publication in this journal is cited, in accordance with accepted academic practice. No use, distribution or reproduction is permitted which does not comply with these terms.

