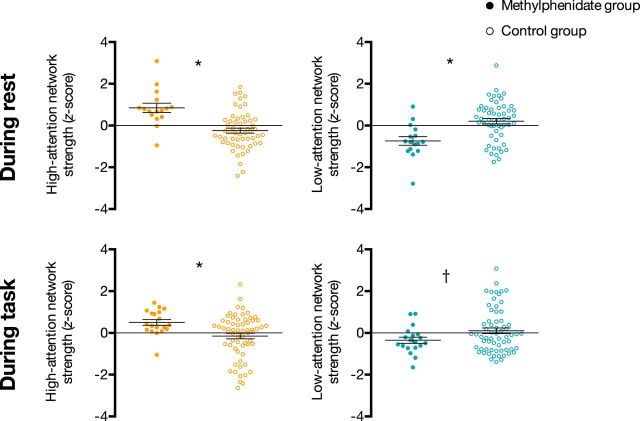
Figure 1.
Strength in the high-attention network (orange) and low-attention network (turquoise) in the methylphenidate and control groups. Network strength was calculated in the rest cohort during rest and the task cohort during task performance, and was normalized within each graph for visualization. Dots represent individual participants, horizontal lines denote group means, and error bars represent standard error of the mean. *p < 0.05 corrected for four comparisons; †p = 0.027 uncorrected.

