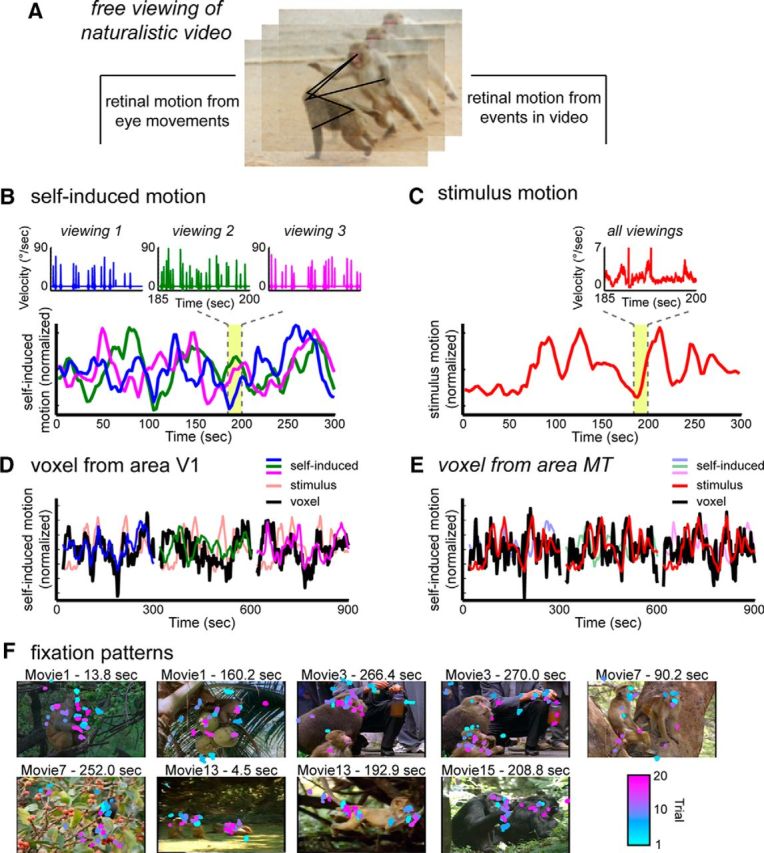
Figure 1.

Creation of time course models for self-induced motion and stimulus motion from the eye movement traces and video stimulus, respectively. A, Subjects freely viewed the events in dynamic movies; thus, two types of visual motion events were present on the retina. These two motion components were decomposed into time courses to create functional maps using the simultaneously recorded fMRI data. B, Self-induced (reafferent) motion was approximated using the measured eye velocity. Eye traces differed for different viewings. Inset, Detailed example. Consequently, a unique self-induced motion function was applied to each dataset (different colored traces). C, Stimulus motion was computed based on the optic flow within the video. For each frame, the mean speed of optic flow was calculated across the entire screen. For all viewings, the self-induced motion and stimulus motion time courses were convolved with a hemodynamic response function and then decimated to match the sampling rate of the fMRI scans. D, Example of self-induced motion responses in area V1 over a 15 min period. The V1 voxel time course closely follows that of the self-induced motion derived from the eye movements. E, Example of stimulus motion responses over same 15 min period in MT. The MT voxel time course closely follows that of the stimulus motion derived from the content of the video stimulus. F, Representative still frames from the presented movies overlaid with the eye position from between 12 and 20 viewings of each movie. The color of each fixation represents the trial from which it came. Fixations were taken within a 200 ms window overlapping the exhibited frame.
