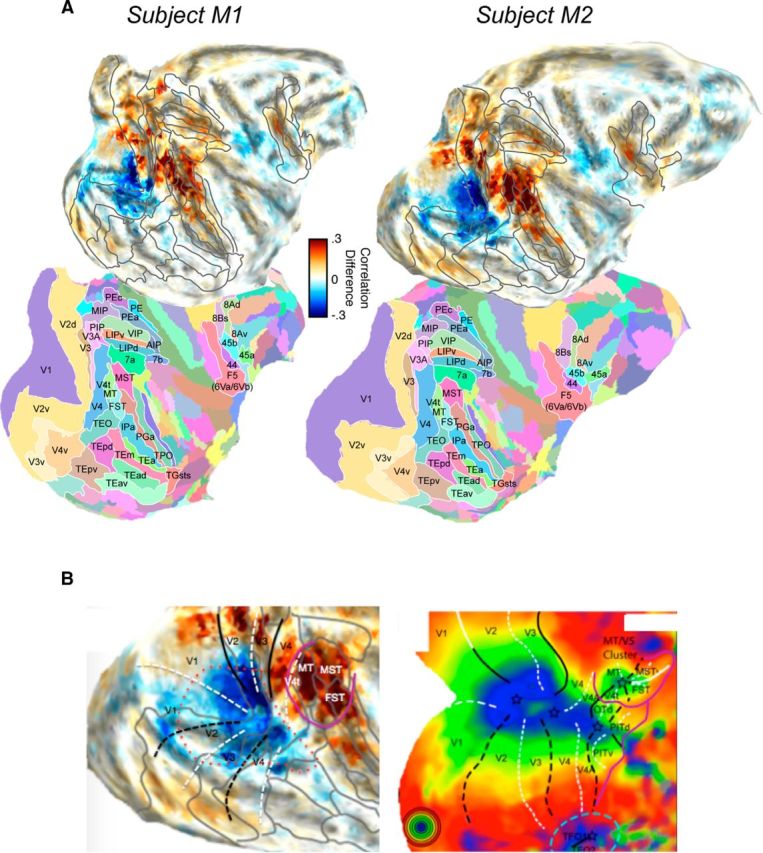
Figure 3.

Detailed areal description of preference for self-induced motion versus stimulus motion for the two monkey subjects. A, Raw (unthresholded) differential activity is shown atop the corresponding areal atlas boundaries from the Saleem and Logothetis atlas (Saleem and Logothetis, 2012), registered independently to the two monkeys through warping of the 3D digital atlas volume (Reveley et al., 2016). Cyan/blue represent more responsivity to self-induced motion. Orange/red represent more responsivity to stimulus motion. B, Diagram comparison showing opposite biases for self-induced versus stimulus motion processing in two broad cortical regions representations of central vision. Left, The difference map from monkey M2, overlaid with a coarse approximate meridian boundaries based on the atlas transitions. Right, fMRI activity map in macaque showing the visual eccentricity for the same regions (adapted from Orban et al., 2014). There are two foci for central vision, corresponding to the continual foveal representation of the early retinotopic areas (red dotted line) and the caudal STS regions (surrounded by purple solid line). White dashed lines indicate the horizontal meridian. Black dashed lines indicate the vertical meridian.
