
Figure 3.
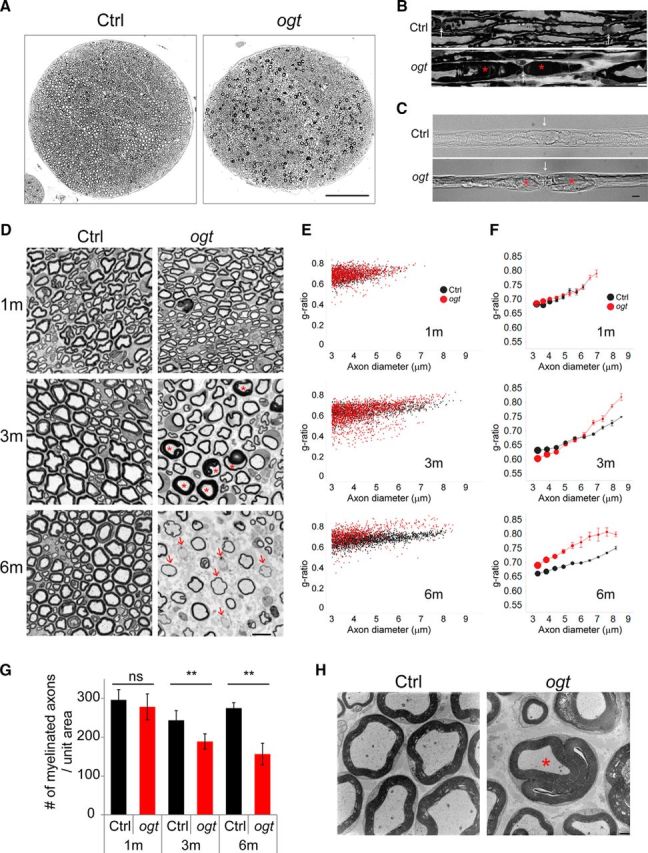
OGT-SCKO mutant mice develop tomaculous demyelinating neuropathy. A, B, Toluidine blue-stained semithin cross section (A) and longitudinal section (B) of sciatic nerves from 3-month-old OGT-SCKO and control mice. A, In cross section, note the numerous dark profiles corresponding to tomacula. B, In the longitudinal section, note the focal hypermyelination/tomacula (asterisks) at paranodal/juxtaparanodal regions in OGT-SCKO nerves (ogt). Arrows denote the node of Ranvier. Scale bars: A, 100 μm; B, 10 μm. C, Differential interference contrast image of teased sciatic nerve fibers from 3-month-old control and OGT-SCKO mice. White arrows indicate node of Ranvier; red asterisks denote tomacula at paranodal/juxtaparanodal region. Scale bar, 10 μm. D, Toluidine blue-stained semithin cross sections of sciatic nerves from OGT-SCKO and control mice at 1, 3, and 6 months of age. In OGT-SCKO nerves, note the abnormal folds (tomacula) of hypermyelinated fibers (asterisks) at 3 months of age and the naked and hypomyelinated axons (arrows) as well as axonal loss at 6 months of age. Scale bar, 10 μm. E, F, Scatter plot analysis (E) and modified bubble chart (F) of g-ratio versus axon diameter for the myelinated fibers in D. In F, axons from 3 to 9 μm in diameter are grouped into 10 bins. The g-ratio is represented as mean ± SEM for each bin. The size of the circle is scaled according to the total number of axons at the indicated size for each genotype; n = 3 mice per genotype at the indicated age. Note the morphometric profiles of tomaculous small-diameter axons with lower g-ratios as well as hypomyelinated large-diameter axons with higher g-ratios in 3-month-old OGT-SCKO nerves. In 6-month-old OGT-SCKO nerves, axons of all sizes are hypomyelinated as reflected by the higher g-ratio. G, Quantification of the number of myelinated fibers per unit area at the indicated age in D. Data are represented as mean ± SEM. Student's t test, **p < 0.01; n = 3 mice per genotype at each age. H, Electron micrograph of sciatic nerve in the cross section from 3-month-old control and OGT-SCKO mice. Tomaculum is indicated by the asterisk. Scale bar, 1 μm.