
Figure 2.
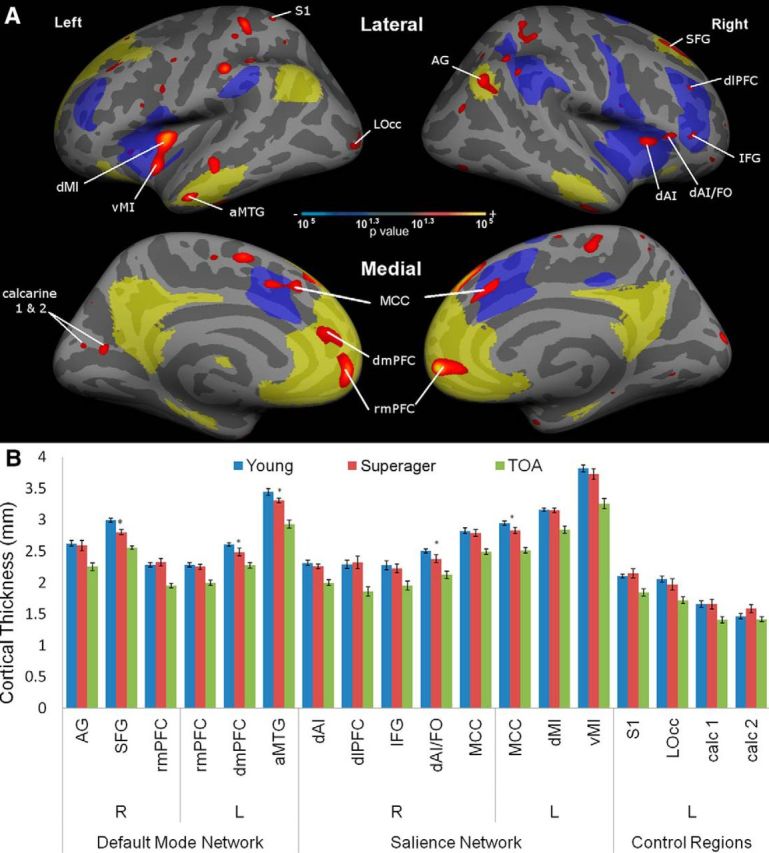
Regions of preserved cortical thickness in superagers within the default mode and salience networks. A, This statistical map shows regions where the cortex of superagers is thicker than in typical older adults (p < 0.05; depicted as a red-to-yellow heat gradient), highlighting regions within a priori hypothesized networks of interest (salience network in blue; default mode network in pale yellow). Four control regions in primary sensory cortical areas outside the networks of interest are labeled for comparison. B, Bar graphs show mean cortical thickness within each region labeled in the map. Although by definition all of these regions are thicker in superagers than typical older adults (TOAs), some of them are thinner in superagers than in young adults (partial preservation indicated with asterisks), while all others are “youthful” in superagers (fully preserved cortical thickness relative to young adults). R, Right hemisphere; L, left hemisphere. Error bars indicate SE.