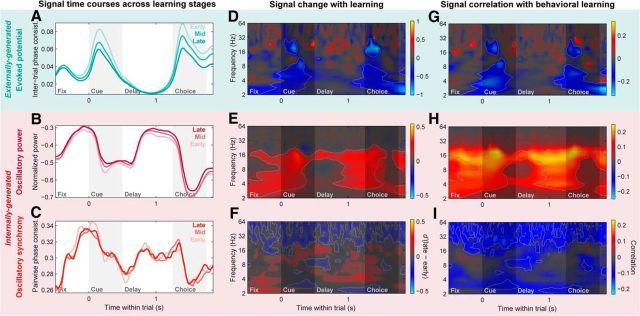
Figure 10.
HPC networks exhibit primarily local changes with learning. Plotting conventions and color scale ranges are same as for corresponding plots in Figure 7. A–C, Population means of HPC evoked potentials (A), LFP power (B), and intra-HPC LFP–LFP synchrony (C) time courses during the early, middle, and late learning stages (light to dark colors). D–F, Change in HPC evoked potentials (D), LFP power (E), and LFP–LFP synchrony (F) with learning (d′ statistic between late and early learning stage population distributions). G–I, Correlation of HPC evoked potentials (G), LFP power (H), and LFP–LFP synchrony (I) with behavioral performance (Spearman rank correlation between LFP signals and percent correct). Like PFC evoked potentials, HPC evoked potentials exhibit broadband decreases with learning. In contrast to the relatively restricted beta-band increases in PFC power and synchrony, HPC power shows broadband increases, while HPC synchrony primarily shows broadband high-frequency (>∼20 Hz) decreases extending through the entire trial period.

