Figure 5.

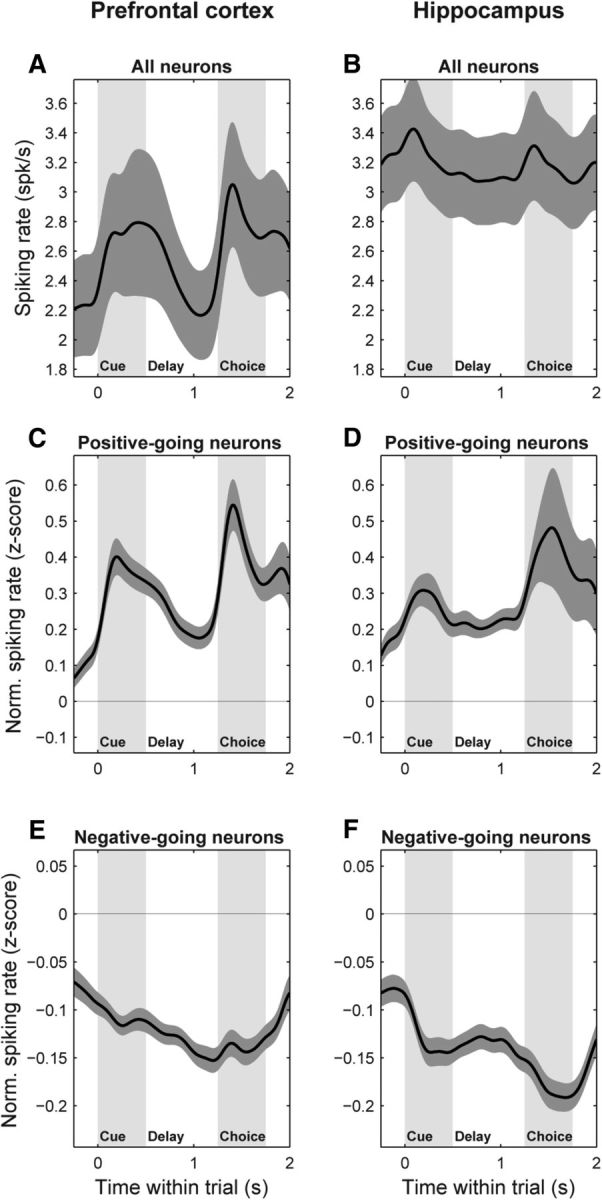
PFC and HPC neurons are both responsive to object stimuli. A, B, Population mean raw spiking rate (±SEM), pooled across all trials, for all sampled neurons in the PFC (A) and HPC (B). C–F, Population mean normalized spiking rate (±SEM), expressed as z-scores relative to the mean and SD of the intertrial interval (−1000 to −500 ms) baseline rate. C, D, PFC (C) and HPC (D) neurons whose average rate during the full trial period (0–1750 ms) was greater than baseline. E, F, PFC (E) and HPC (F) neurons whose average rate during the full trial period was less than baseline. Both areas show clear spiking responses to the cue and choice objects of comparable magnitude.
