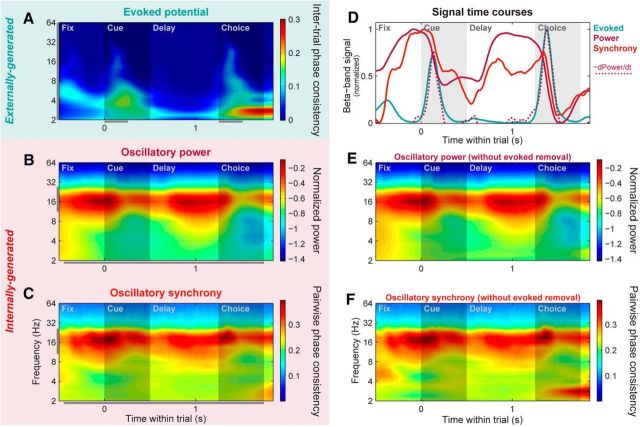
Figure 9.
HPC networks exhibit similar dynamics for local and global oscillations. Plotting conventions and color scale ranges are the same as for corresponding plots in Figure 6. A, Population mean evoked potentials (intertrial phase consistency) across all individual HPC LFP sites, computed across all trials. B, Population mean log-transformed power across all individual HPC LFP sites, pooled across all learning session trials. C, Population mean synchrony (PPC) across all pairs of HPC LFP sites, pooled across all trials. D, Within-trial time courses of evoked potential (blue line), power (solid magenta line), and cross-electrode synchrony (orange) signals, pooled within the beta band (11–27 Hz). Like the PFC, HPC LFP power peaked before the onsets of the cue and choice objects, and rapidly decreased (dotted magenta line) nearly simultaneously with the transient stimulus-evoked potentials. In contrast to the PFC, oscillatory synchrony across HPC sites exhibited a time course similar to power, also peaking before the stimulus onsets. E, F, HPC mean power (E) and synchrony (F) computed without removal of trial-locked evoked potential signals. As in the PFC, removing the evoked potentials had virtually no effect outside of the lowest frequencies.

