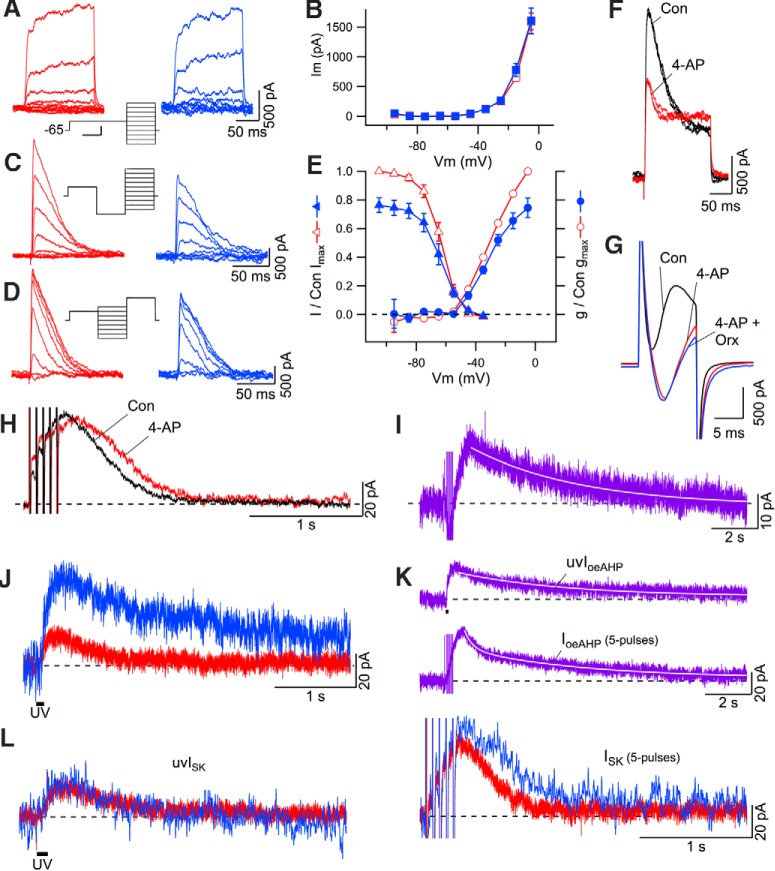
Figure 8.
The enhanced SK component of IoeAHP results from orexin inhibition of A-current but not delayed rectifier current in DR neurons. A, Leak-subtracted (−p/4) delayed rectifier currents before (left, red) and after (right, blue) application of orexin-A (300 nm; calibrations on right apply to both sets of current). Middle, Voltage protocol and holding potential. Calibration: Middle, 100 ms, 20 mV. B, Summary (mean ± SEM) of the delayed rectifier current steady-state I–V relations before (open squares, red) and after (filled squares, blue) orexin (n = 6). C, Leak-subtracted (−p/4) transient outward currents evoked by the A-current activation protocol (middle traces; holding potential and calibration as in A) before (left, red) and after (right, blue) application of orexin-A (300 nm). D, Leak-subtracted (−p/4) transient outward currents evoked by the A-current deinactivation protocol (middle traces; holding potential and calibration as in A) before (left, red) and after (right, blue) application of orexin-A (300 nm). E, Summary (mean ± SEM) of the voltage dependence of activation and inactivation of the transient outward current before (open symbols, red) and after (filled symbols, blue) orexin application (n = 6), normalized to the control Imax and Gmax before orexin application. F, The transient outward current was monitored by depolarizing test pulses to −15 mV following a 75 ms hyperpolarizing conditioning pulse to −105 mV, showing characteristic blocking by 5 mm 4-AP. Three traces before 4-AP application (black) and three traces following the maximum blockade (red) are superimposed. G, CACs evoked by voltage steps to −5 mV (10 ms duration) from a holding potential of −65 mV from before (Con, black), during (4-AP, red) application of 5 mm 4-AP, and after application of orexin-A (300 nm; Orx, blue). H, SK currents evoked by the 5 pulse protocol (holding potential = −65 mV) from before (Con, black) and after A-current blockade with 5 mm 4-AP (red). I, The average IoeAHP (n = 8) produced by subsequent application of orexin-A (300 nm) in 5 mm 4-AP. The decay was well fit with a single slow exponential (white line). J, Outward currents produced by single full-field UV pulses (100 ms) to uncage Ca2+ from DMNP before (red) and after (blue) application of orexin-A (300 nm). The holding current preceding each trace was subtracted. K, The average IoeAHP (n = 5) computed from currents evoked by UV pulses (top, uvIoeAHP) and from interleaved 5 pulse protocols (bottom, IoeAHP, 5 pulses). uvIoeAHP was well fit with a slow single exponential (white line on top trace) while the IoeAHP (5 pulses) was well fit with a double exponential having medium and slow time constants (white line on bottom trace). Calibration on bottom trace applies to both traces. L, Examples of SK current evoked by a UV pulse (uvISK, UV, 100 ms, left traces) and a 5 pulse protocol (ISK, 5 pulses, right traces) from before (red) and after (blue) application of orexin-A (300 nm). Holding current preceding each trace was subtracted from each trace. Calibration on right applies to both sets of traces.

