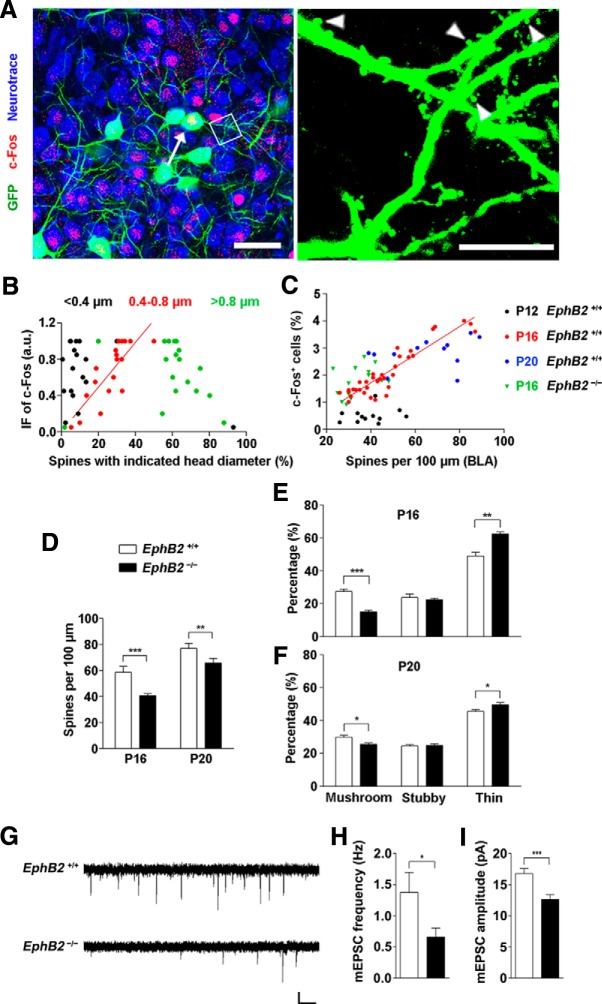
Figure 7.
EphB2 mediates spine morphogenesis in amygdala of juvenile mice. A, GFP labeled c-Fos-positive neurons (arrow indicates the neuron) and c-Fos-negative neurons in BLA at P16. Scale bars: left, 20 μm; right, 5 μm. Arrowheads indicate the spines. B, Correlation of the immunofluorescence (IF) intensity of c-Fos with percentage of spines with indicated diameter in c-Fos-positive neurons. The three types of spines are <0.4 μm (black dots; r2 = 0.13), 0.4–0.8 μm (red dots; r2 = 0.66, p < 0.001), and >0.8 μm (green dots; r2 = 0.09), respectively. n = 18 neurons. C, The percentage of activated c-Fos-positive cells was correlated with mean of spine density (number of spines per 100 μm dendrite) in the BLA area of individual brain slice at P16 (red dots), but not at P12 (black dots) or P20 (blue dots). The correlation was disrupted in EphB2−/− mice at P16 (green triangles). D, EphB2 mutant showed low spine density in BLA neurons at P16. Quantification of spine density in EphB2+/+ and EphB2−/− mutants at P16 and P20 (n = 15 per group) is shown. E, F, Quantification of the percentages of mushroom, stubby, and thin spine types in BLA neurons at P16 and P20. n = 15 per group. G, mEPSCs were recorded in BLA neurons from EphB2+/+ and EphB2−/− mice at P16. Calibration: 10 pA, 1 s. H, I, Quantification of mEPSC frequency (H) and amplitude (I) for BLA neurons from EphB2+/+ and EphB2−/− mice. n = 18 neurons. Data are presented as mean ± SEM. *p < 0.05; **p < 0.01; ***p < 0.001.

