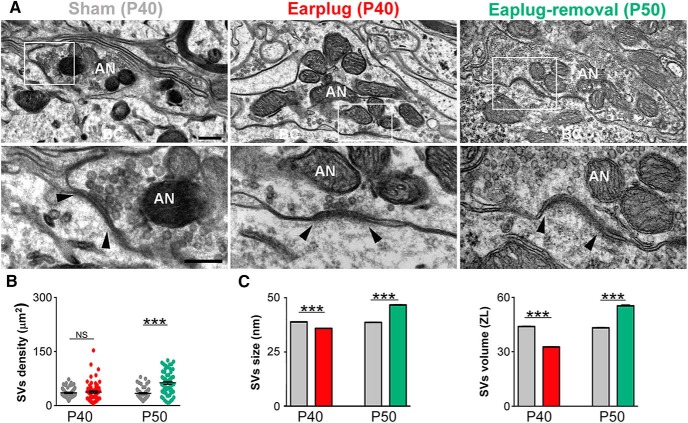
Figure 3.
Changes in SV density, size, and volume in response to monaural conductive hearing loss. A, Electron micrographs of auditory nerve synapses on bushy cells of sham (P40), earplugged (P40), and postearplug-removal (P50) groups. White boxed areas are shown at higher magnification on the bottom row. Arrowheads note the edge of the PSD. AN, Auditory nerve; BC, bushy cell. Scale bars: top row, 250 nm; bottom row, 200 nm. B, Plot of the density of SVs per square micrometer of auditory nerve endings. SV density was similar in age-matched shams and earplugged animals (p = 0.07, Mann–Whitney U test) but was significantly increased in the earplug-removal group compared with age-matched shams (p < 0.0001, Mann–Whitney U test). Error bars are ± SEM. C, The mean SV size was significantly lower in the earplugged animals compared with age-matched shams (***p < 0.0001, Mann–Whitney U test), but it was significantly higher in the earplug-removal group compared with age-matched shams (***p < 0.0001, Mann–Whitney U test). Error bars are ± SEM. The mean SV volume was significantly lower in the earplugged animals compared with age-matched shams (***p < 0.0001, Mann–Whitney U test), but it was significantly higher in the earplug-removal group compared with age-matched shams (***p < 0.0001, Mann–Whitney U test). Error bars are ±SEM.

