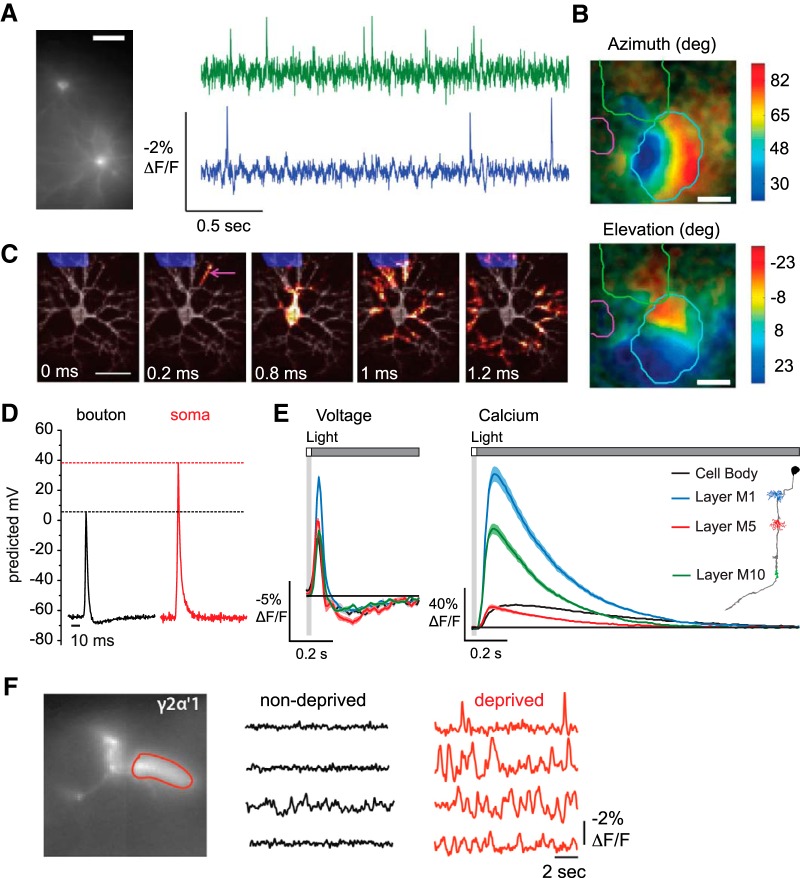
Figure 2.
Applications of GEVIs across experimental systems. A, Simultaneous single-trial recordings of action potentials from two neurons in cortical area V1 of an awake mouse. Cells were illuminated with light-emitting diodes (LEDs) at a power density of 25 mW/mm2 and imaged at 1 kHz using a scientific complementary metal-oxide semiconductor camera. Scale bar, 40 μm. Adapted with permission from Gong et al. (2015). B, Retinotopic maps from wide-field imaging of cortical layer 2/3 neurons in an awake mouse in response to 2 Hz flickering visual stimuli. Top, Stimulus azimuth response map. Bottom, Stimulus elevation response map. Responses to each stimulus were averaged over 20 trials. Scale bar, 1 mm. The brain was illuminated with an LED and photons were collected at 50 Hz using a scientific complementary metal oxide semiconductor camera. Contour lines indicate the boundaries of the visual cortex (blue), barrel cortex (green), and auditory cortex (pink). Adapted with permission from Madisen et al. (2015). C, Action potential backpropagation in a cultured rat hippocampal neuron. Illumination was performed with a laser at a power density of 3000 mW/mm2. Fluorescence was collected at 1 kHz using an electron multiplying charge-coupled device. Subframe interpolation was used to infer submillisecond timing from image sequences averaged over 203 action potentials. Scale bar, 50 μm. Adapted with permission from Hochbaum et al. (2014). D, Action potentials recorded from a presynaptic bouton and the soma of the same cultured hippocampal neuron. Action potential amplitude was calibrated by comparing the fluorescence change elicited by an action potential with the fluorescence change elicited by application of gramicidin, which brought the resting membrane potential to 0 mV. Traces were averaged over 9 cells, 400 trials per cell. Neurons were illuminated with a laser at a power density of ∼22,500 mW/mm2, with fluorescence captured at 2 kHz using an electron multiplying charge-coupled device. Adapted with permission from Hoppa et al. (2014). E, In vivo voltage (left) and calcium (right) signals recorded across subcellular regions of the Drosophila visual interneuron Tm3 in response to 25 ms flashes of light off of a gray background. Cells were imaged with two-photon laser scanning microscopy at a frame rate of 38.9 Hz that was upsampled during analysis to 120 Hz. Power was ∼10 mW at the sample plane. Response traces for each region are mean ± 1 SEM averaged over 13–158 cells, 100 trials per cell for voltage, 50 trials per cell for calcium. Adapted with permission from Yang et al. (2016). F, Single-trial spontaneous electrical activity recorded in the dendrites of sleep-promoting γ2α′1 cells in acute brain explants from sleep-deprived and nondeprived Drosophila. Cells were illuminated with an LED and fluorescence captured at a frame rate of 125 Hz using a charge-coupled device. Adapted with permission from Sitaraman et al. (2015).

