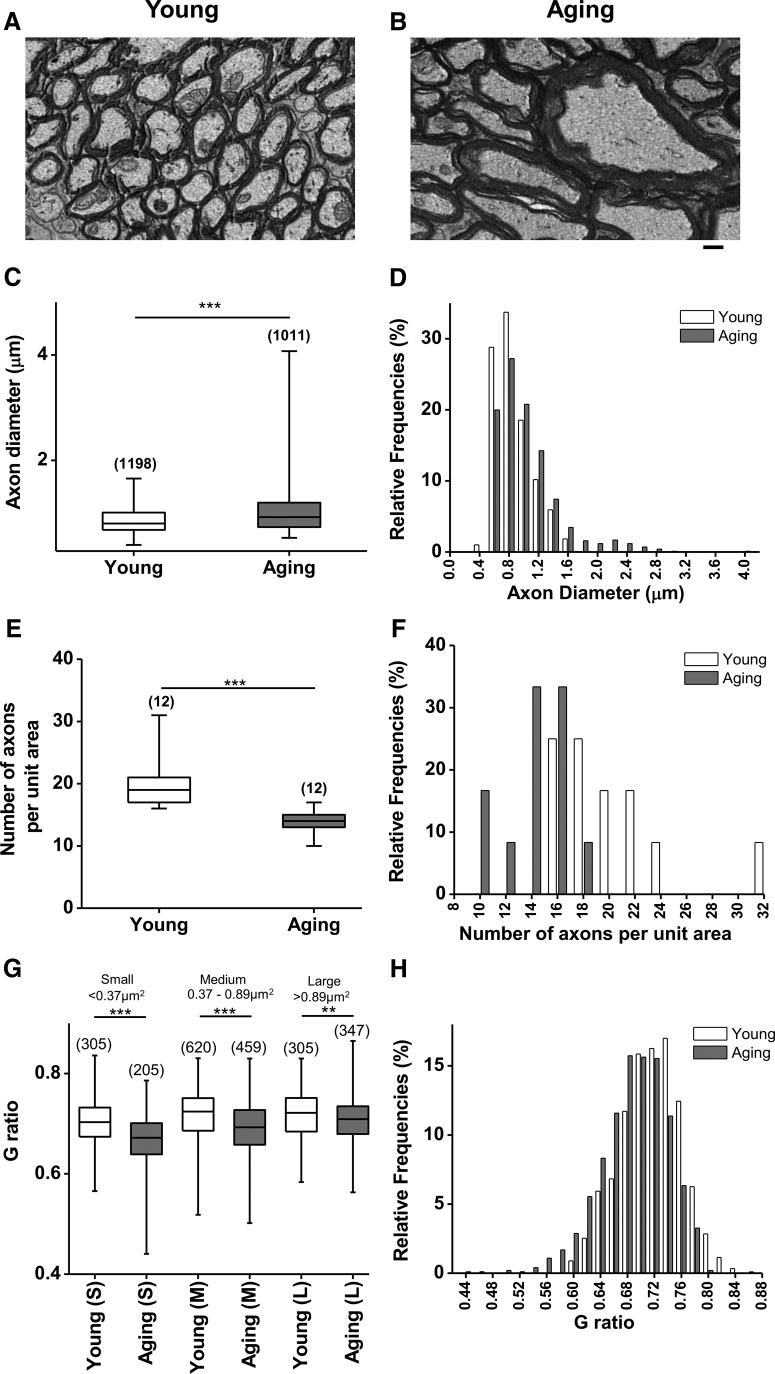
Figure 2.
An age-related increase in axonal diameter correlates with a lower g ratio due to increased thickness of the myelin sheath. A, B, Single plane cross-sectional images obtained from 3-D EM stacks show numerous round axons in young (A) and fewer but larger axons in aging (B) optic nerve. Scale bar (B), 0.5 μm. C–F, The diameter of axons increased from 0.4–1.6 μm (median, 0.8 μm; n = 1198) to 0.5–4.1 μm (median, 0.9 μm; n = 1011; ***p < 0.0001, two-tailed Mann–Whitney U test; C, D), while the number of axons decreased (E, F), reducing the number of axons per unit area with aging (median, 18.5 axons/μm2; n = 12) to 14 axons/μm2 (n = 12; ***p = 0.0002, two-tailed Mann–Whitney test). G, H, Because the myelin sheath wrapped around axons increased more compared to axon diameter, the g-ratio (diameter of axon/diameter of axon + myelin thickness) was reduced independent of axon diameter with aging. Boxes in C, E, and G show the median with the first and third quartiles. Bars in D, F, and H indicate relative frequencies.

