
Figure 3.
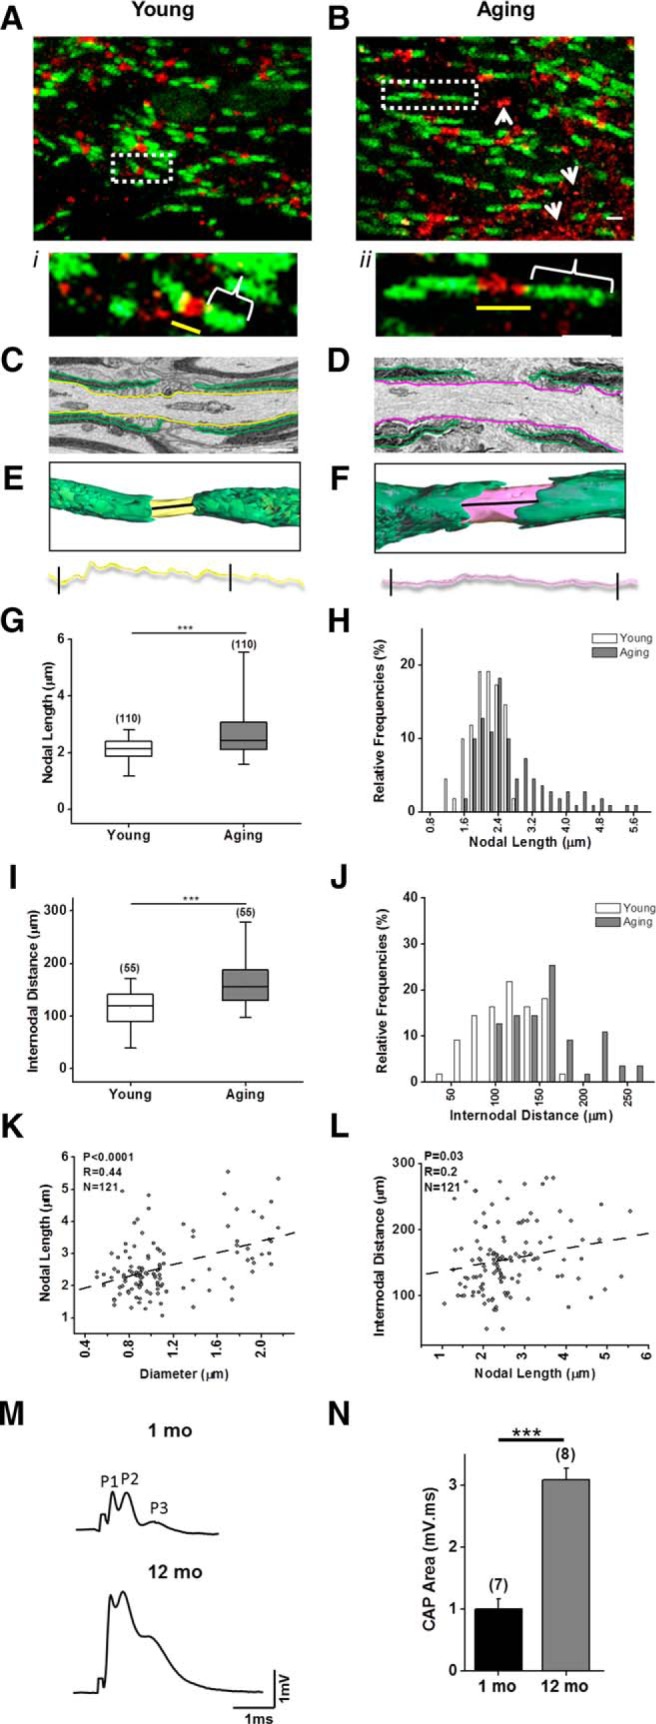
Aging results in longer nodal and paranodal lengths without affecting axon conduction properties. A, B, Immunohistochemical labeling of Nav1.6 (red) and Caspr (green) in young (1 month old; A) and aging (12 month old; B) optic nerves showed reorganization of nodal and paranodal regions with aging such that in addition to the nodal region, Nav1.6 immunoreactivity showed ectopic localization (white arrows), while Caspr was thinner and elongated (white brackets) and nodal length was longer (yellow line; i, ii). C–F, Tracing young (yellow; C) and aging (magenta; D) axons and paranodal structures (green) in longitudinal sections of 3-D EM images outlined nodal lengths in young (yellow; E) and aging (magenta; F) axons. Nodal lengths were extracted from reconstructed 3-D EM images and the interval quantified is shown between brackets (black lines). G–L, Nodal (young, median, 2.1 μm, n = 110; aging, 2.4 μm, n = 110; G, H) and internodal distances increased in aging axons (young, median 120.1 μm, n = 55; aging, 155.4 μm, n = 55; I, J), maintaining a proportional relationship such that nodal length increased with increases in axon diameter (Spearman's correlation, r = 0.44, p < 0.0001; K) and internodal distance increased with increased nodal length (Spearman's correlation, r = 0.19, p = 0.029; L). M, N, Despite age-dependent reorganization of nodal architecture (M), the conduction velocity properties of evoked CAPs remained constant, as depicted by three individual peaks (P1, P2, and P3, reflecting three subsets of axons; N) and improved spatiotemporal summation of axon function (p < 0.0001, unpaired two-tailed Student's t test). Boxes in G and I show the median with the first and third quartiles. Bars in H and J show relative frequencies, and bars in N show mean ± SEM. ***p < 0.0001 (two-tailed Mann–Whitney U test).