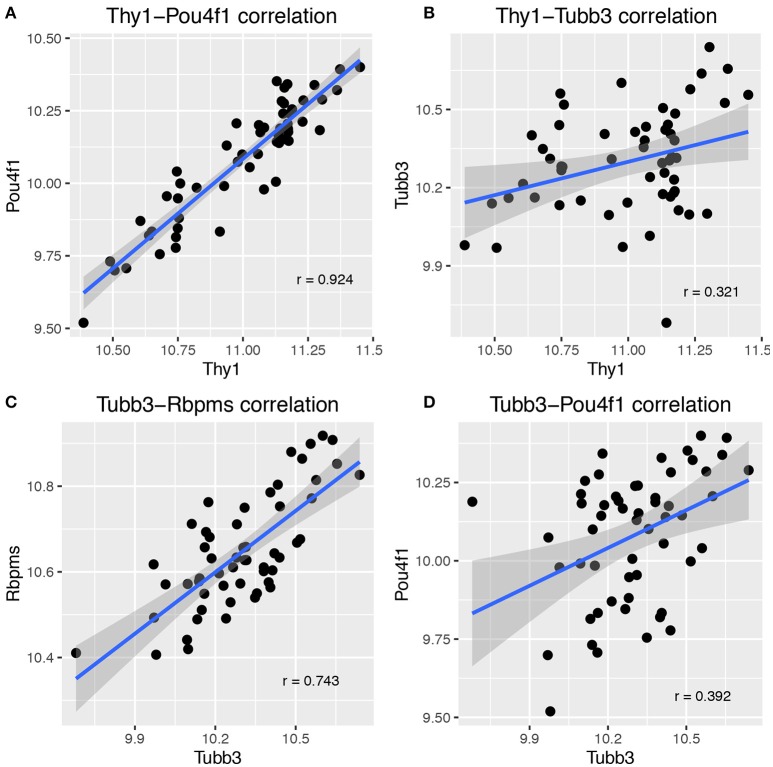
Figure 2.
Scatterplots illustrating the correlation between major RGC markers. There was a tight correlation between Thy1 and Pou4f1 (A), which are part of the same network. Correlation dropped greatly for Thy1 and Tubb3 (B), which are not part of the same network. Similarly, Tubb3 correlated well with Rbpms (C) but not with Pou4f1 (D). Pearson's correlation coefficient is given in each plot on the lower right half. Each dot represents one BXD RI strain, and the confidence interval for the smoothing function (dark gray areas surrounding the blue line) is 0.95.

