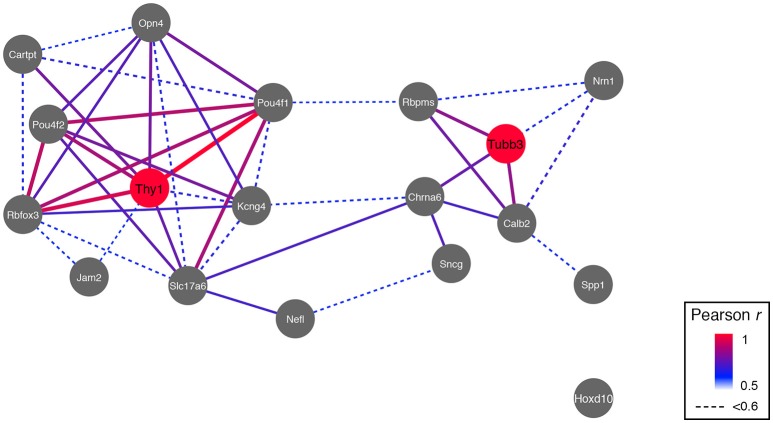
Figure 5.
RGC markers segregate into two networks, and two major hubs are formed around Thy1 and Tubb3. The only connection between the Thy1- and the Tubb3-network is through two of their correlates, Slc17a6 and Chrna6. Pearson's correlation coefficient was mapped to line color and thickness (high correlation = thicker and red bars).

