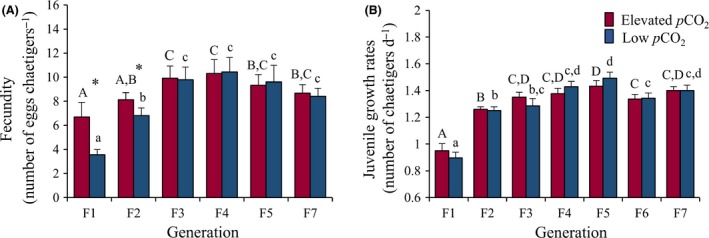
Figure 3.

Experiment 1: effect of the multi‐generational exposure to elevated and low p CO 2 on mean fecundity (A) and juvenile growth rates (B) of O. labronica. Asterisk (*) indicates significant differences (P < 0.05) between p CO 2 treatments within a generation. Capital and lower case letters represent significant differences (P < 0.05) between generations for the elevated and low p CO 2 treatments, respectively. Bar charts represent mean values ±95% CI. Numbers of replicates are reported in Table S1.
