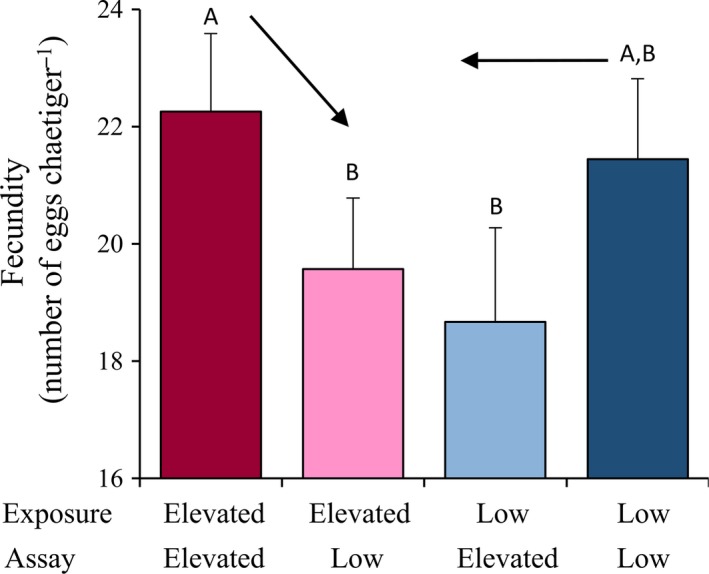
Figure 4.

Experiment 2: reciprocal transplant assays. Mean fecundity of O. labronica individuals of the F7 generation exposed to either an elevated or low p CO 2 and then transplanted to same (control assay) or other p CO 2 treatments (reciprocal assay). Capital letters represent significant differences (P < 0.05) between transplant treatments. Bar charts represent mean values ±95% CI. Arrows represent reaction norms between control and reciprocal transplants. Numbers of replicates are reported in Table 3.
