
Figure 1.
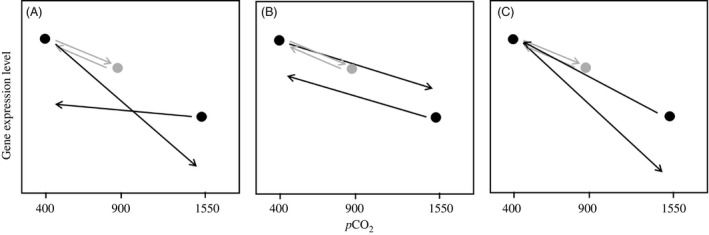
The three hypotheses used to examine the gene expression data. (A) Hypothesis 1: Different slopes but equal elevation interpreted as a transgenerational development of different reaction norms (i.e., transgenerational development of different phenotypic plasticity) at 1550 μatm pCO 2; (B) Hypothesis 2: Equal slopes but different elevation interpreted as a transgenerational development of different phenotype (i.e., adaptation) at 1550 μatm pCO 2; (C) Hypothesis 3: Different slopes and elevation. All three hypotheses assumed pure phenotypic plasticity between 400 and 900 μatm pCO 2 as depicted by the gray arrows.