
Figure 1.
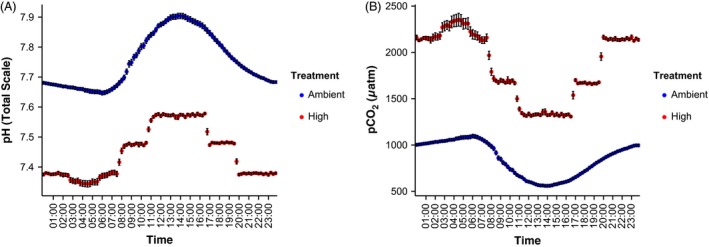
Average (mean ± SEM) diurnal cycle of experimental treatments in the common garden exposure tanks. (A) pH (NBS scale) was measured every 15 min in the tanks and converted to total scale (see Materials and methods for details). (B) pCO 2 was calculated from pH (total scale) and average total alkalinity and salinity in each tank (see Materials and methods and Table 1 for details).