
Figure 2.
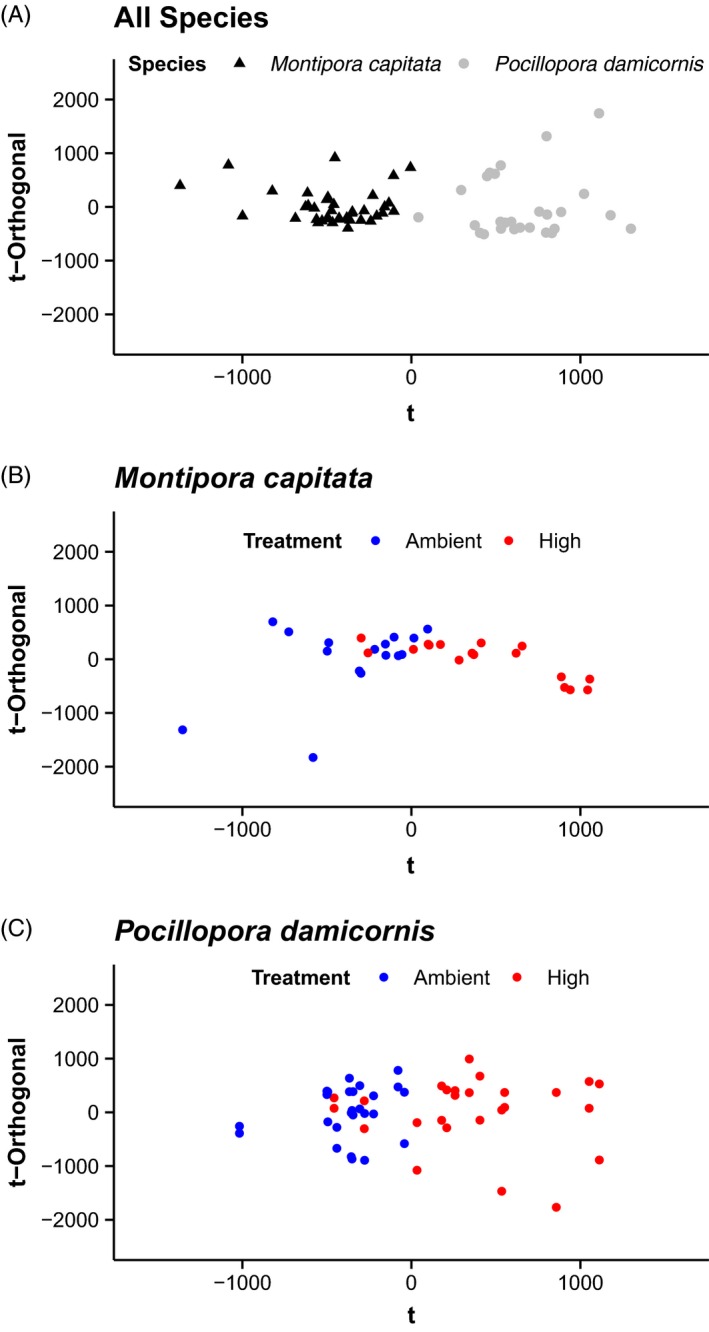
OPLS‐DA models of 1 H‐NMR metabolomic profiles for (A) coral species (n = 39 for Montipora capitata, n = 27 for Pocillopora damicornis), (B) by treatment for M. capitata samples (n = 17 for ambient, n = 17 for high), and (C) by treatment for P. damicornis samples (n = 13 for ambient, n = 13 for high). See text for model statistical results.