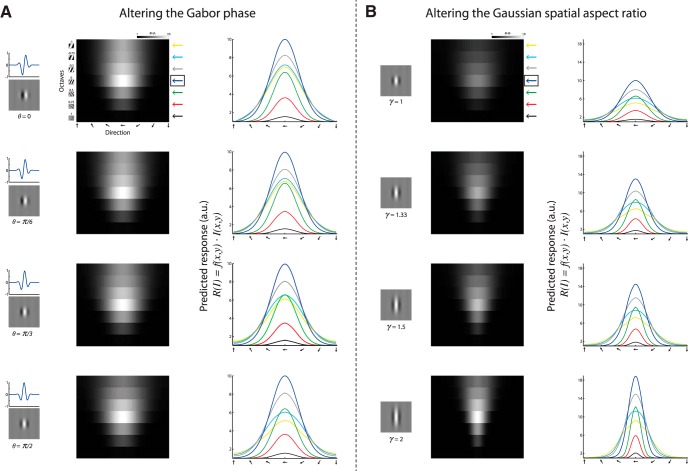
Figure 4.
Altering the Gabor model parameters for predicting neural responses. A, A predicted response tuning matrix computed as the inner product between the Gabor RF model shown in Figure 3 and stimuli of square-wave gratings with various orientations (1º interval) and seven SFs. Each pixel represents the inner product between the RF and the stimulus (maximized across phase). The row marked with a blue arrow on the right denotes the preferred SF and was taken as a reference for comparing other SFs. Right, Orientation–tuning curves at various SFs, color coded according to the arrows shown next to the predicted tuning matrix. Each panel corresponds to RF with θ = 0, θ = π/6, θ = π/3, and θ = π/2. a.u., Arbitrary units. B, Same as in A only for an RF with θ = π/2 and various spatial aspect ratios (γ). Each panel corresponds to RF with γ = 1, γ = 1.33, γ = 1.5, and γ = 2. Note that these parameter alterations alone could not qualitatively explain a shift in the preferred orientation of the cells at different SFs.

