Figure 5.
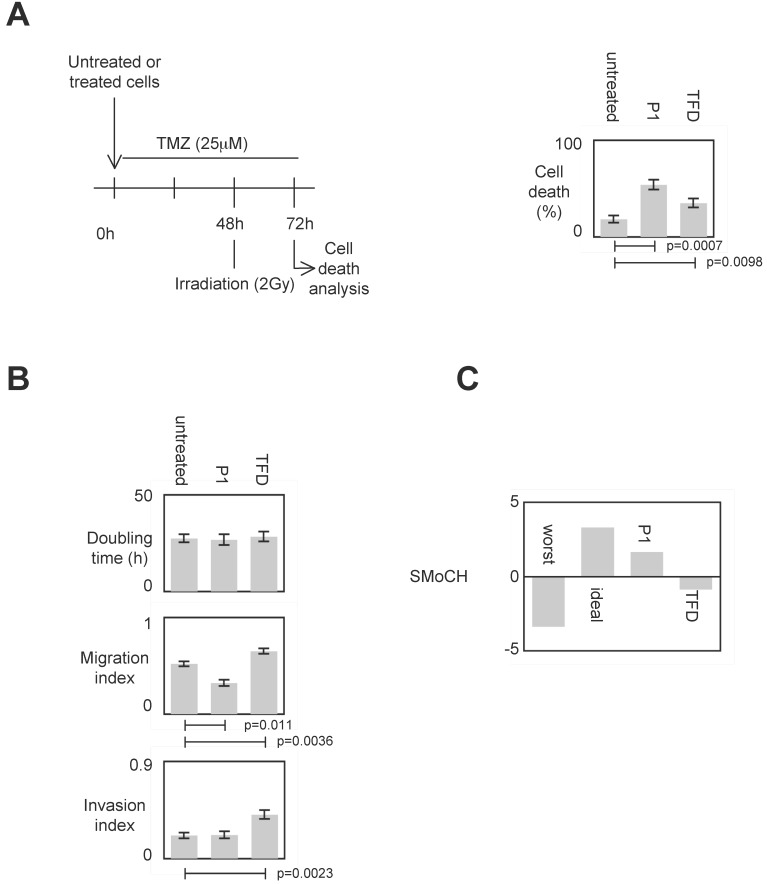
Impact of P1 on cancer hallmarks/phenotypes. A. Schematic representation of the temozolomide/irradiation-induced cell death. Percentages of cell death were evaluated by using a Trypan Blue Stain 0.4%, and the Countess® Automated Cell Counter (Life Technology, France). p values were obtained by performing a t test. B. Doubling time (i.e. the period of time required for a quantity to double in size) was calculated by using the http://www.doubling-time.com/compute.php website and counting the proliferation of 103 cells during 120 hours. Migration index was calculated by performing a scratch test. Invasion index was estimated by using cell invasion assay according to the manufacturer's instructions (Millipore, France). Graphs illustrate the average±SD of 3 independent experiments. p values were obtained by performing a t test. C. Score of Modulation of Cancer Hallmarks (SMoCH) was calculated by attributing -1 when the peptide/treatment enhanced a cancer hallmark, 0 when peptide/treatment did not modify a cancer hallmark and +1 when the peptide/treatment inhibited a cancer hallmark. By taking into consideration 4 cancer hallmarks/phenotypes, a worst anticancer treatment theoretically obtains SMoCH=-4, while an ideal anticancer treatment theoretically obtains SMoCH=+4.

