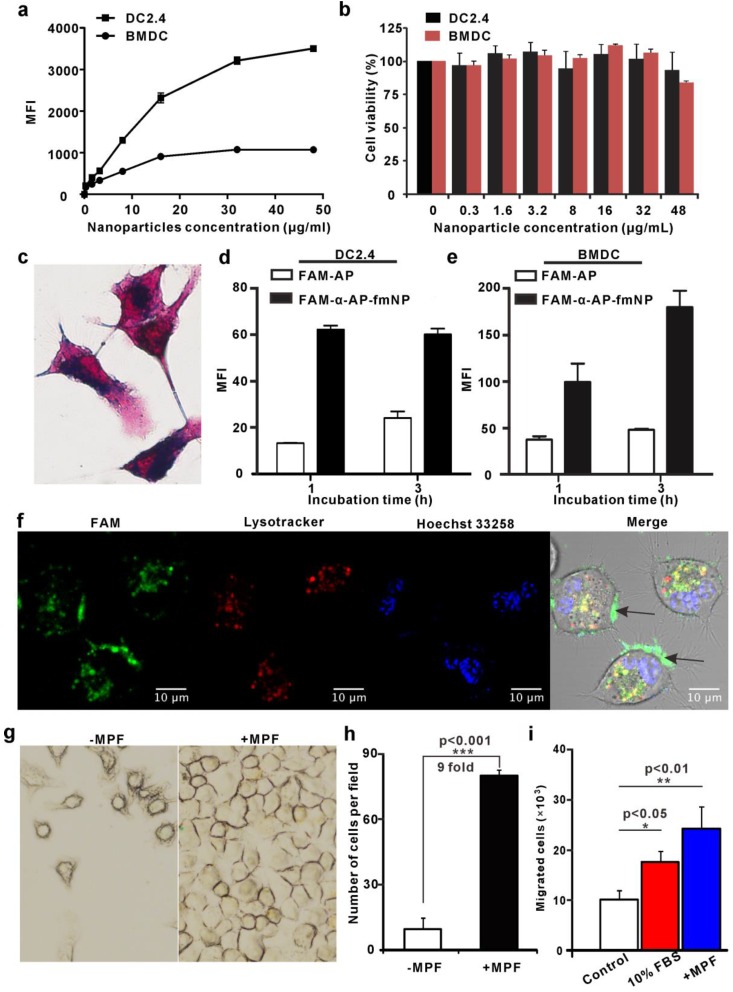
Figure 2.
Analysis of α-AP-fmNPs uptake by BMDCs and DC2.4 cells and in vitro evaluation of MPF-promoted DC migration. a) Flow cytometric assessment of cellular α-AP-fmNPs uptake. The mean fluorescence intensity (MFI) was recorded and presented as the mean ± SEM (n = 3). b) Effect of α-AP-fmNPs labeling on the viability of BMDCs and DC2.4 cells. c) Prussian blue staining of α-AP-fmNP-internalized DC2.4 cells. d-e) Comparison of intracellular uptake of FAM-α-AP-fmNPs and FAM-AP in DC2.4 cells (d) and BMDCs (e). All experiments were carried out in triplicate. f) Determination of the subcellular localization of α-AP-fmNPs. Confocal imaging of DC2.4 cells incubated with FAM-α-AP-fmNPs for 6 h and stained with LysoTracker and Hoechst 33258. g) Representative images of migrated cells in the absence (-MPF) or presence (+MPF) of MPF. α-AP-fmNP-loaded DC2.4 cells were resuspended in a cell culture flask with a magnet attached to one side of the flask for 24 h, and the photograph of the migrated cells was acquired. h) Calculations of the migrated cells from bright images. Data were acquired from nine fields of view of three independent images. i) Analysis of the migration ability of α-AP-fmNP-loaded BMDCs. The number of the migrated BMDCs in the lower chamber was counted via flow cytometry. All experiments were carried out in triplicate. Data are presented as mean ± SEM (n = 3).

