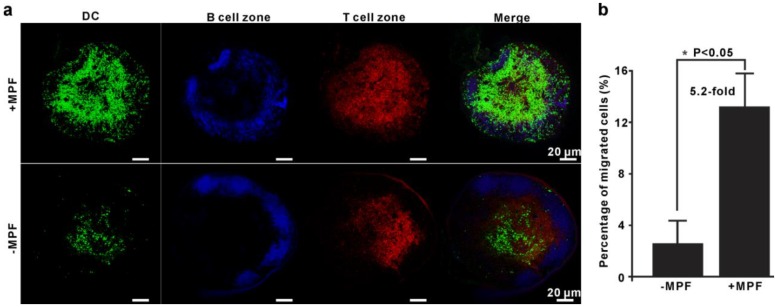
Figure 4.
Validation of MPF-assisted in vivo DC migration. a) Representative immunofluorescence images of PLNs from either MPF-treated mice (+MPF, top panels) or control mice (-MPF, bottom panels). The green, blue, and red signals indicate EGFP-expressing BMDCs, B cell zone (Alexa fluor 647 anti-B220), and T cell zone (Alexa fluor 594 anti-CD3), respectively. b) Calculation of the average percentage of migrated cells to PLN by EGFP fluorescence. The EGFP-BMDCs were obtained from EGFP-transgenic mice. The PLNs were dissected and mechanically disrupted to obtain single cell suspensions, and the EGFP-positive cells in these solutions were analyzed by flow cytometry. Each group contained 2-3 mice and the indicated results represent the means ± SEM of three independent experiments.

